Tornado Hunting: Greenfield, IA Severe Weather Ingredients for May 21, 2024
What made the Greenfield, Iowa Tornado so devastating? A look at the meteorolgic setup from that day. On May 21, 2024, an EF4 tornado struck Greenfield, Iowa. Using PyRe Weather, we can go...
Let's hunt down the Greenfield, Iowa tornado from May 21, 2024
On May 21, 2024, an EF4 tornado struck Greenfield, Iowa. Using PyRe Weather, we can go back to that afternoon and see how the different elements needed for severe weather (tornadoes, hail, and severe thunderstorms) came together.
For severe thunderstorms, there are four basic things we're looking for: moisture, instability, lift, and wind shear. Warm air near the surface often contributes to that instability, and temperature maps can also make fronts and contrasting air masses remarkably easy to see.
Heat
Let's start with a basic temperature map from that afternoon, around 1 p.m. local time. Click on the link below the map to create this map in your own browser and learn the basics of using the site.
Surface Temperature, May 21, 2024, 18Z
Open this map in the builder ->
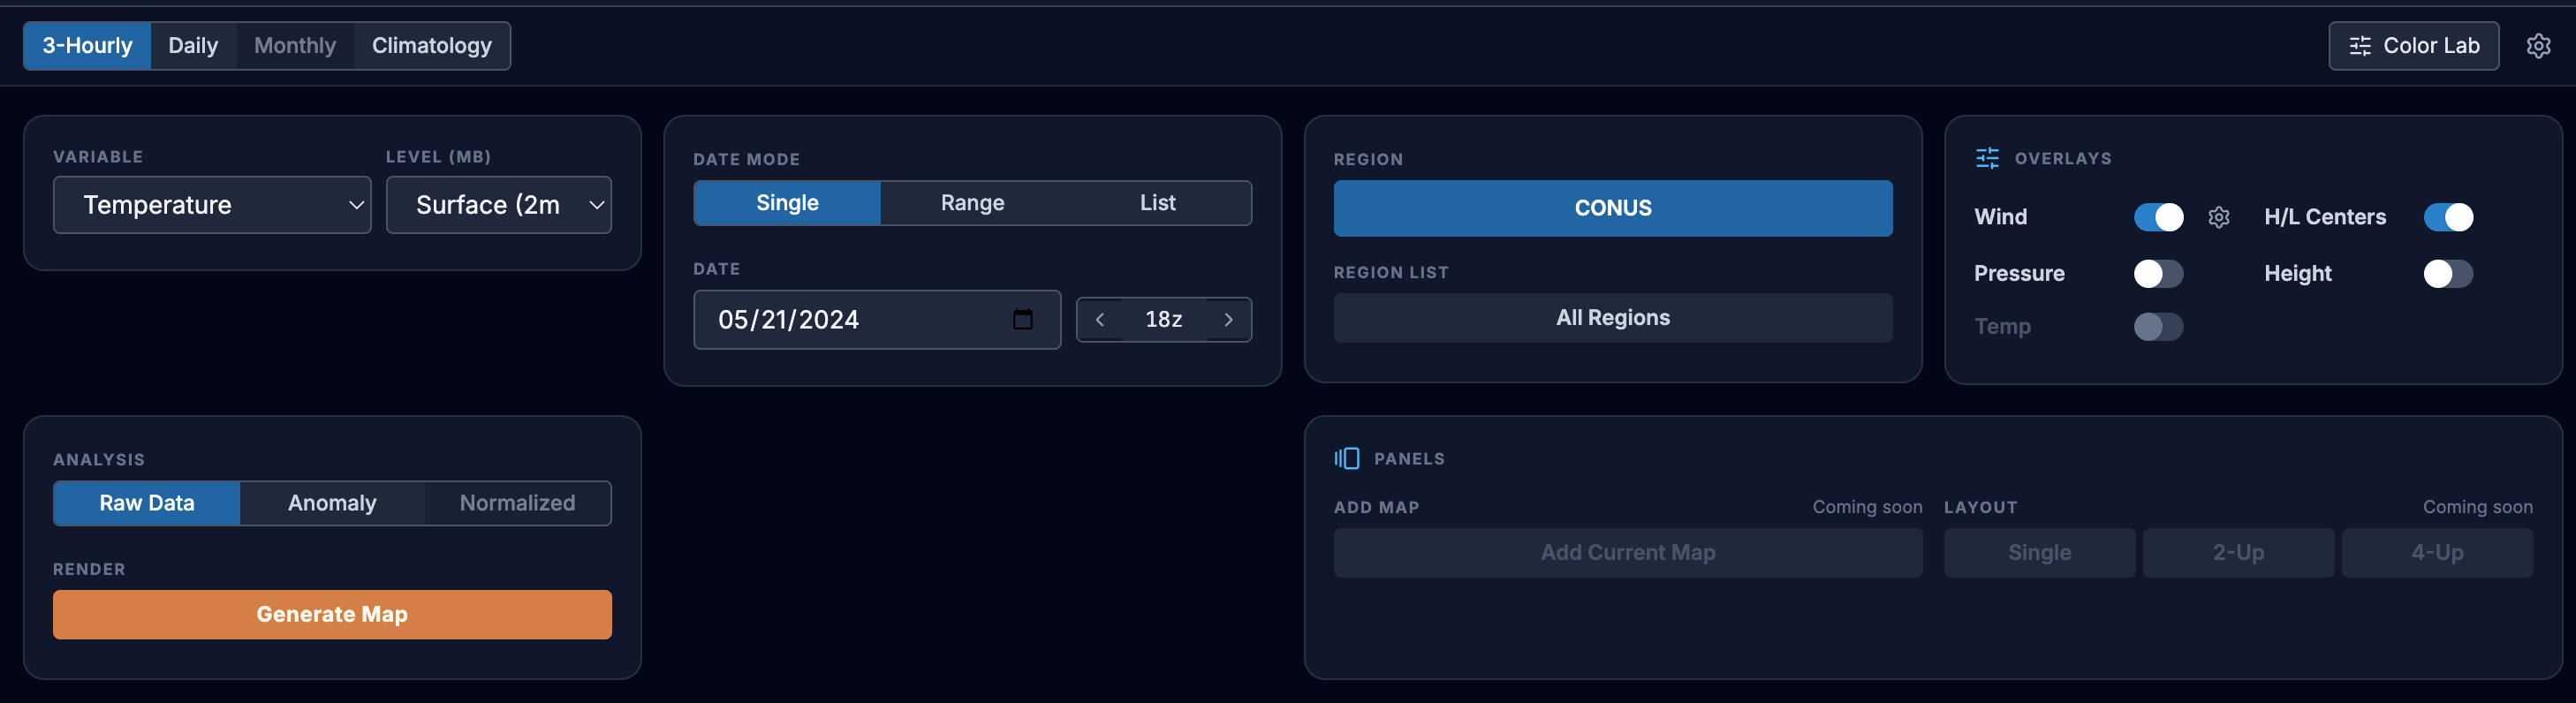
The builder settings will look like this when you use the link in the builder. Select 3-hourly time scale from the top left, Temperature at the Surface (2m) from the two selectors below that. For Date range, choose single, and add the date of the event, and the hour (00, 03, 06, 09, 12, 15, 18, 21Z are all available), the site defaults to the Continental US (will soon be adding global preferences for other users), This is often abbreviated CONUS. On the right panel, the wind selector is toggled on, and the High/Low centers are also toggled on (H/L Centers). Click the orange "Generate Map" button to see the map. it should look exactly like the one below.
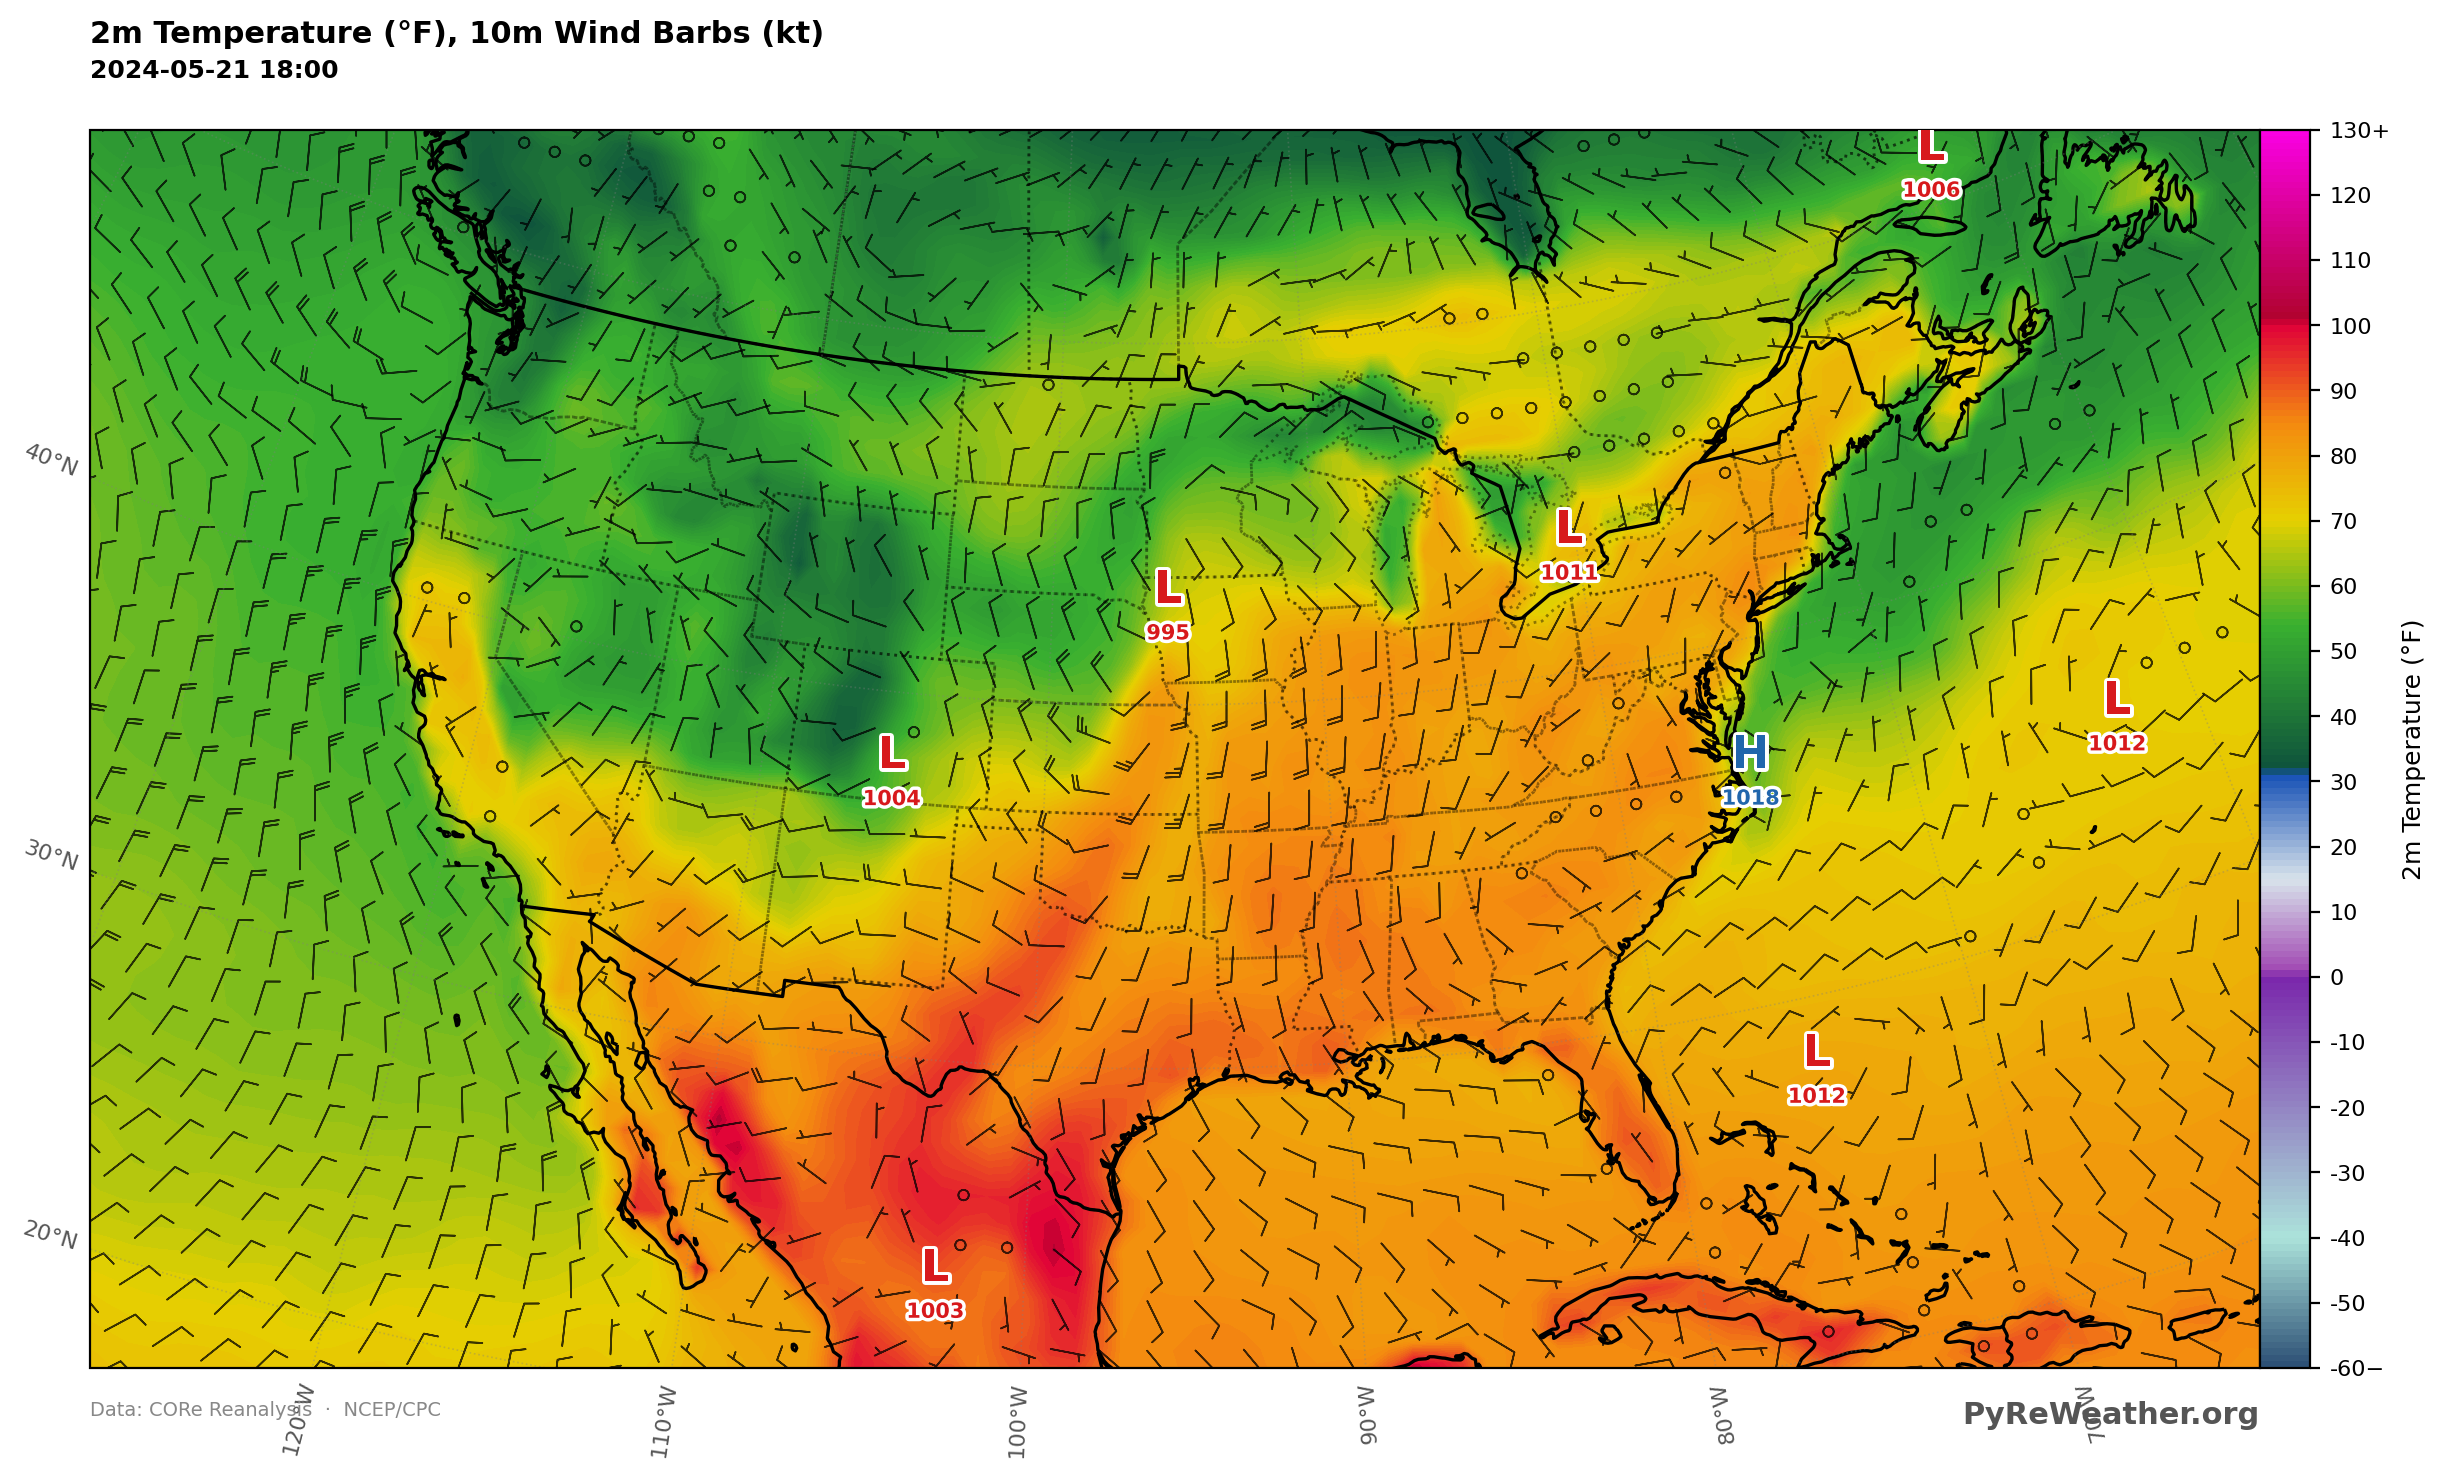
In this map, you can quickly see where colder air across the northwestern part of the country meets the much warmer air farther south and east. In fact, the boundaries are so dramatic that you can almost see the cold fronts draped from one low to the next, strung like a necklace of pearls across the U.S.
Look for the three letter "L"s: one over southern Colorado, another over northwestern Iowa, and a third near Lake Erie.
Between them, you can see sharp boundaries separating the green and yellow temperature zones. The fronts are sitting right along these transitions between very different air masses.
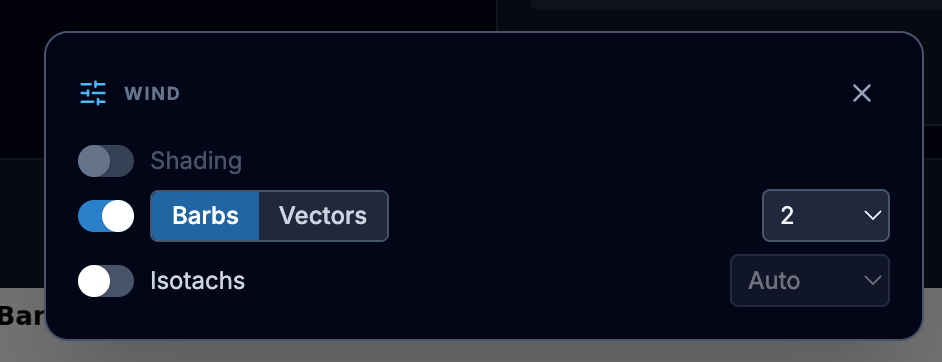
Builder Note: If you click the little gear next to the wind toggle on the right, you can further customize how you want the wind to appear. Barbs are the most common, and the density of the barbs can be left on auto for most maps, or you can change it. The default for CONUS is 2, so if you want fewer barbs or vectors, select 3 or higher and click regenerate.
Moisture
For the next map, try creating it on your own before using the link at the bottom of the article.
One of the quickest ways to look at moisture is with dew point or relative humidity.
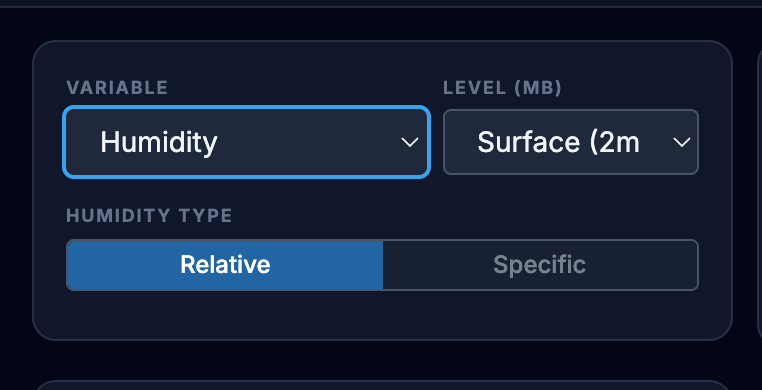
Update the temperature map by finding the Variable dropdown in the upper left of the mapping window and selecting Humidity. Another selector will appear underneath it. For now, leave that set to Relative. Leave the level at Surface (2m) and click the orange Generate Map button.
Relative Humidity, May 21, 2024, 18Z
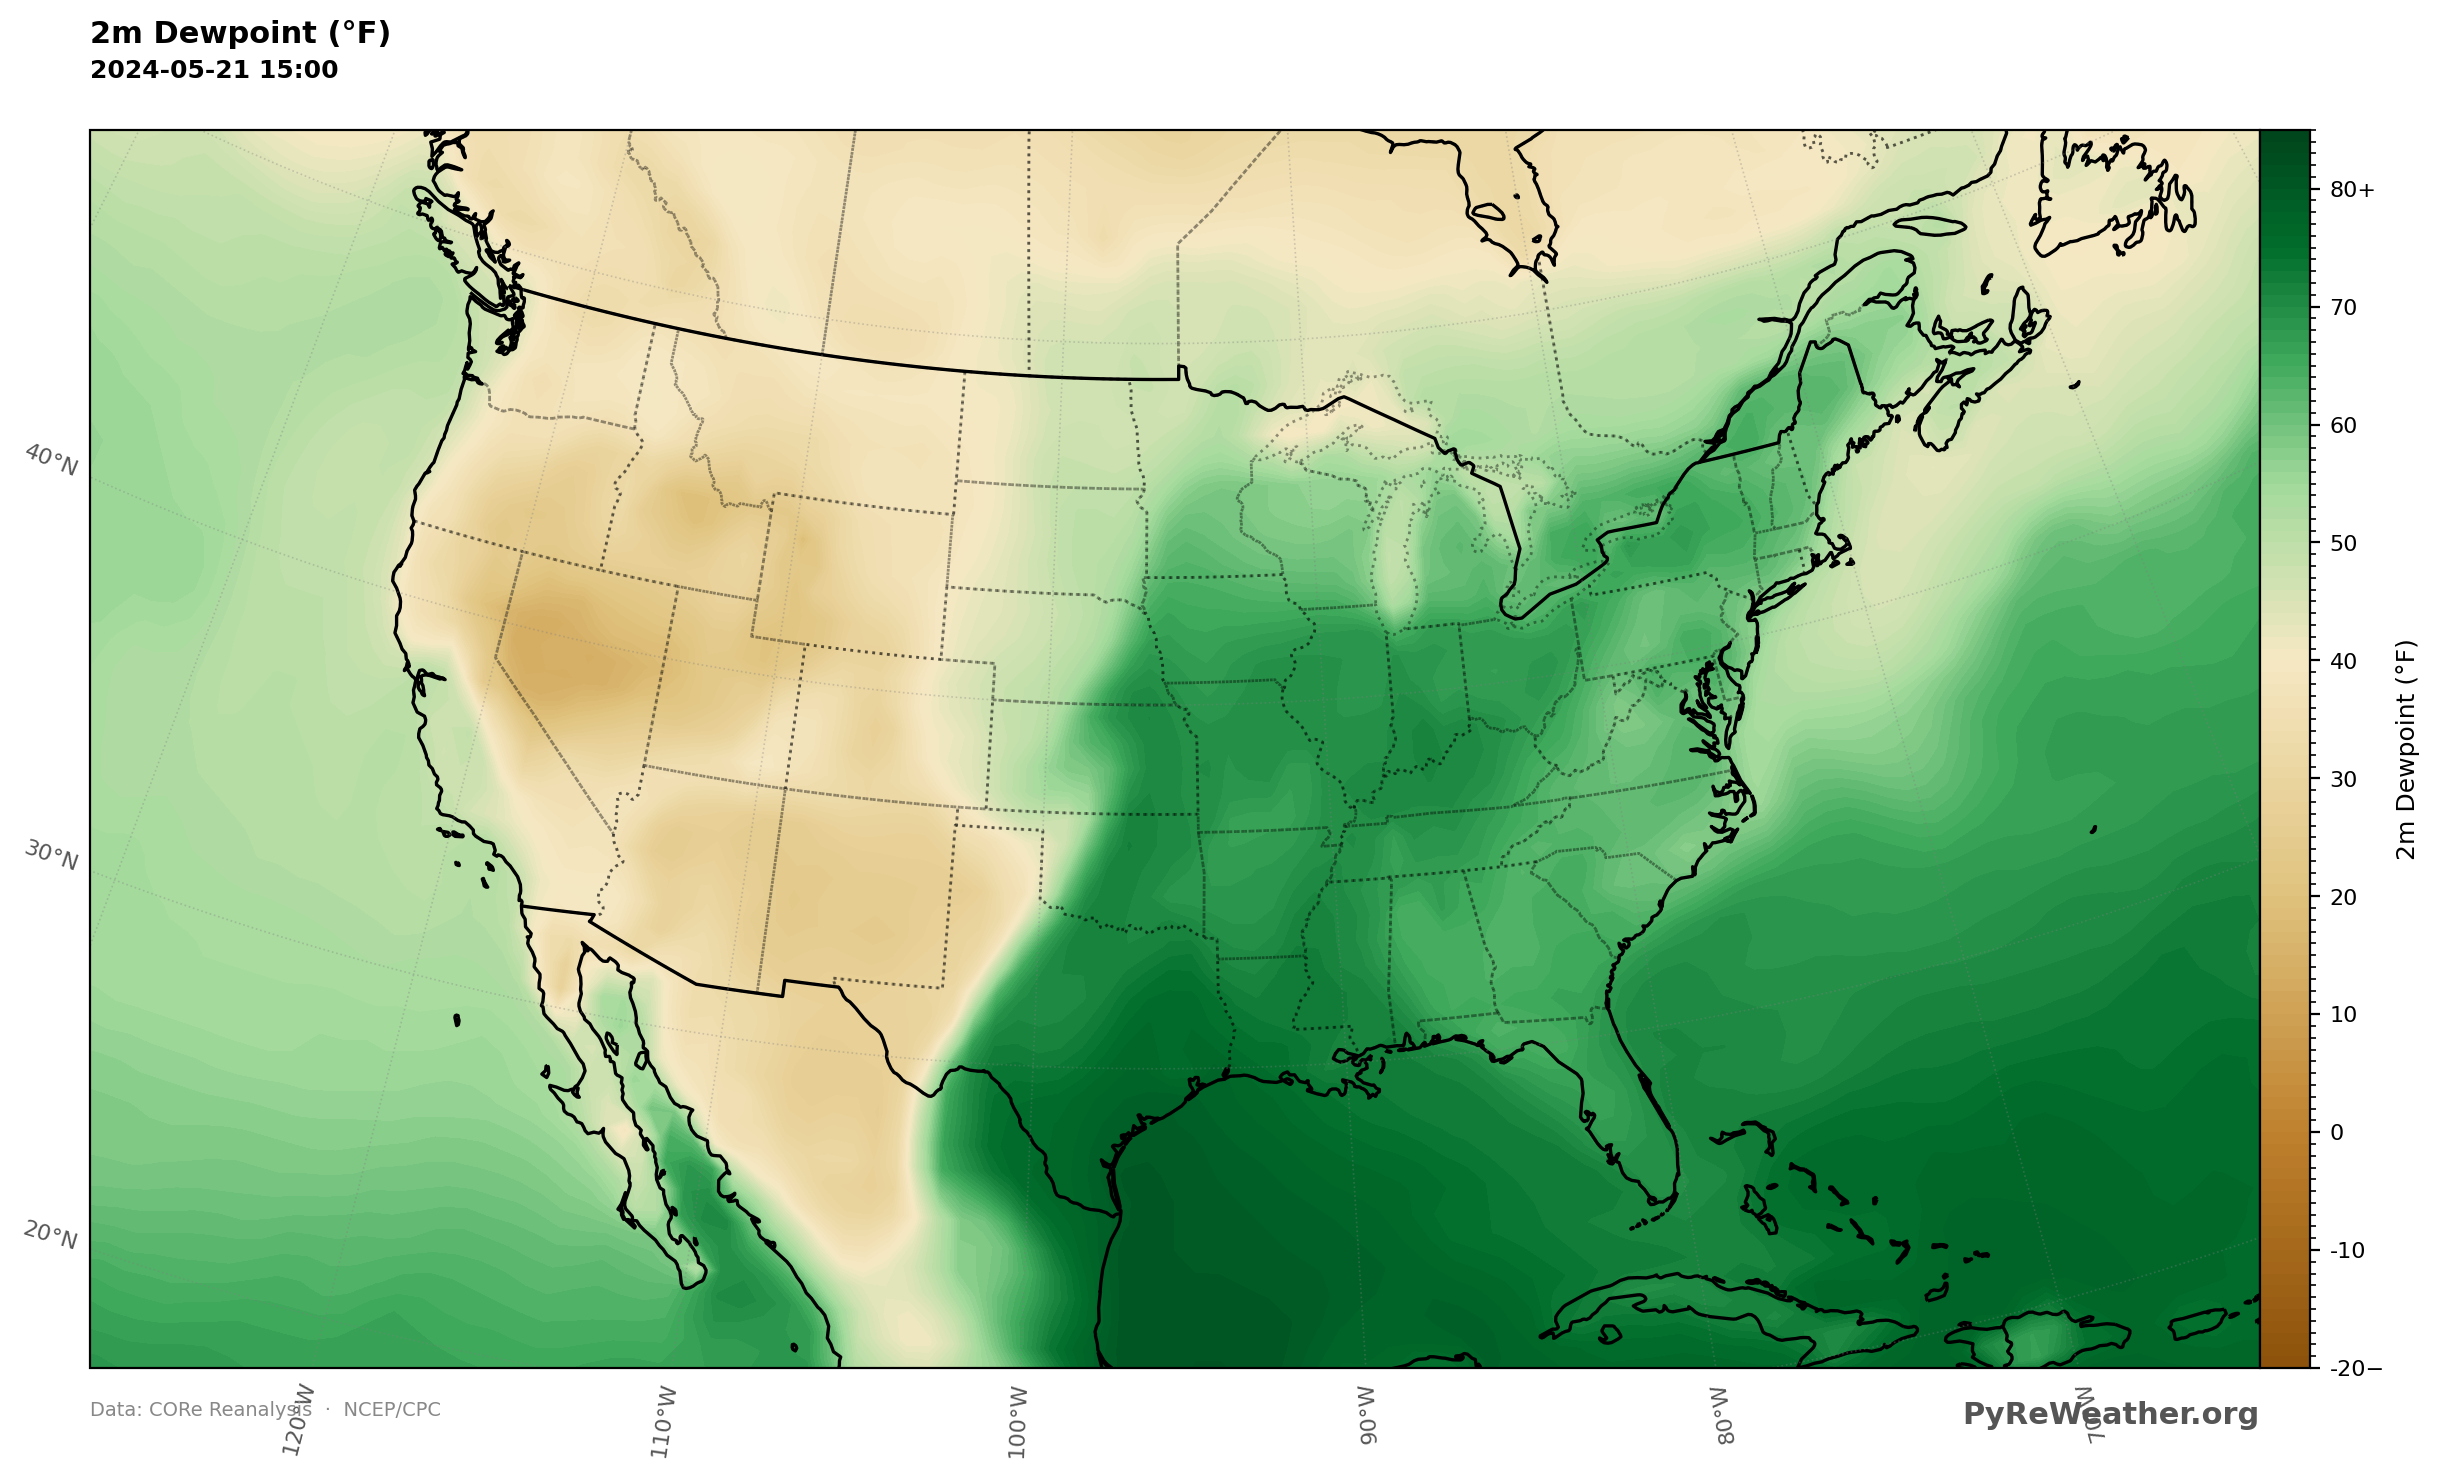
In this impressive map, you should see a broad swath of humid air extending north from the Gulf of Mexico and right into Iowa and Minnesota.
You may have heard of the Low-Level Jet (LLJ), a corridor of relatively strong winds in the lower atmosphere that can transport enormous amounts of moisture northward from the Gulf.
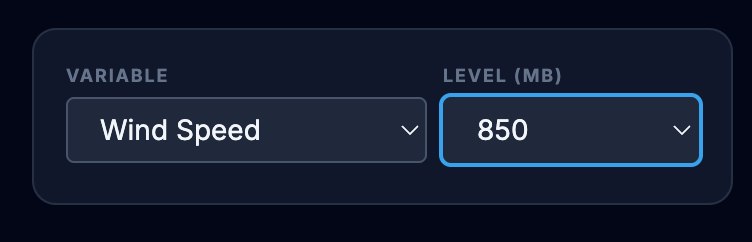
We can get a look at those lower-atmosphere winds by changing the variable to Wind Speed, and changing the level to 850 mb, roughly a mile above sea level, and generating the map again.
Wind Speed, 850mb, May 21, 2024, 18Z
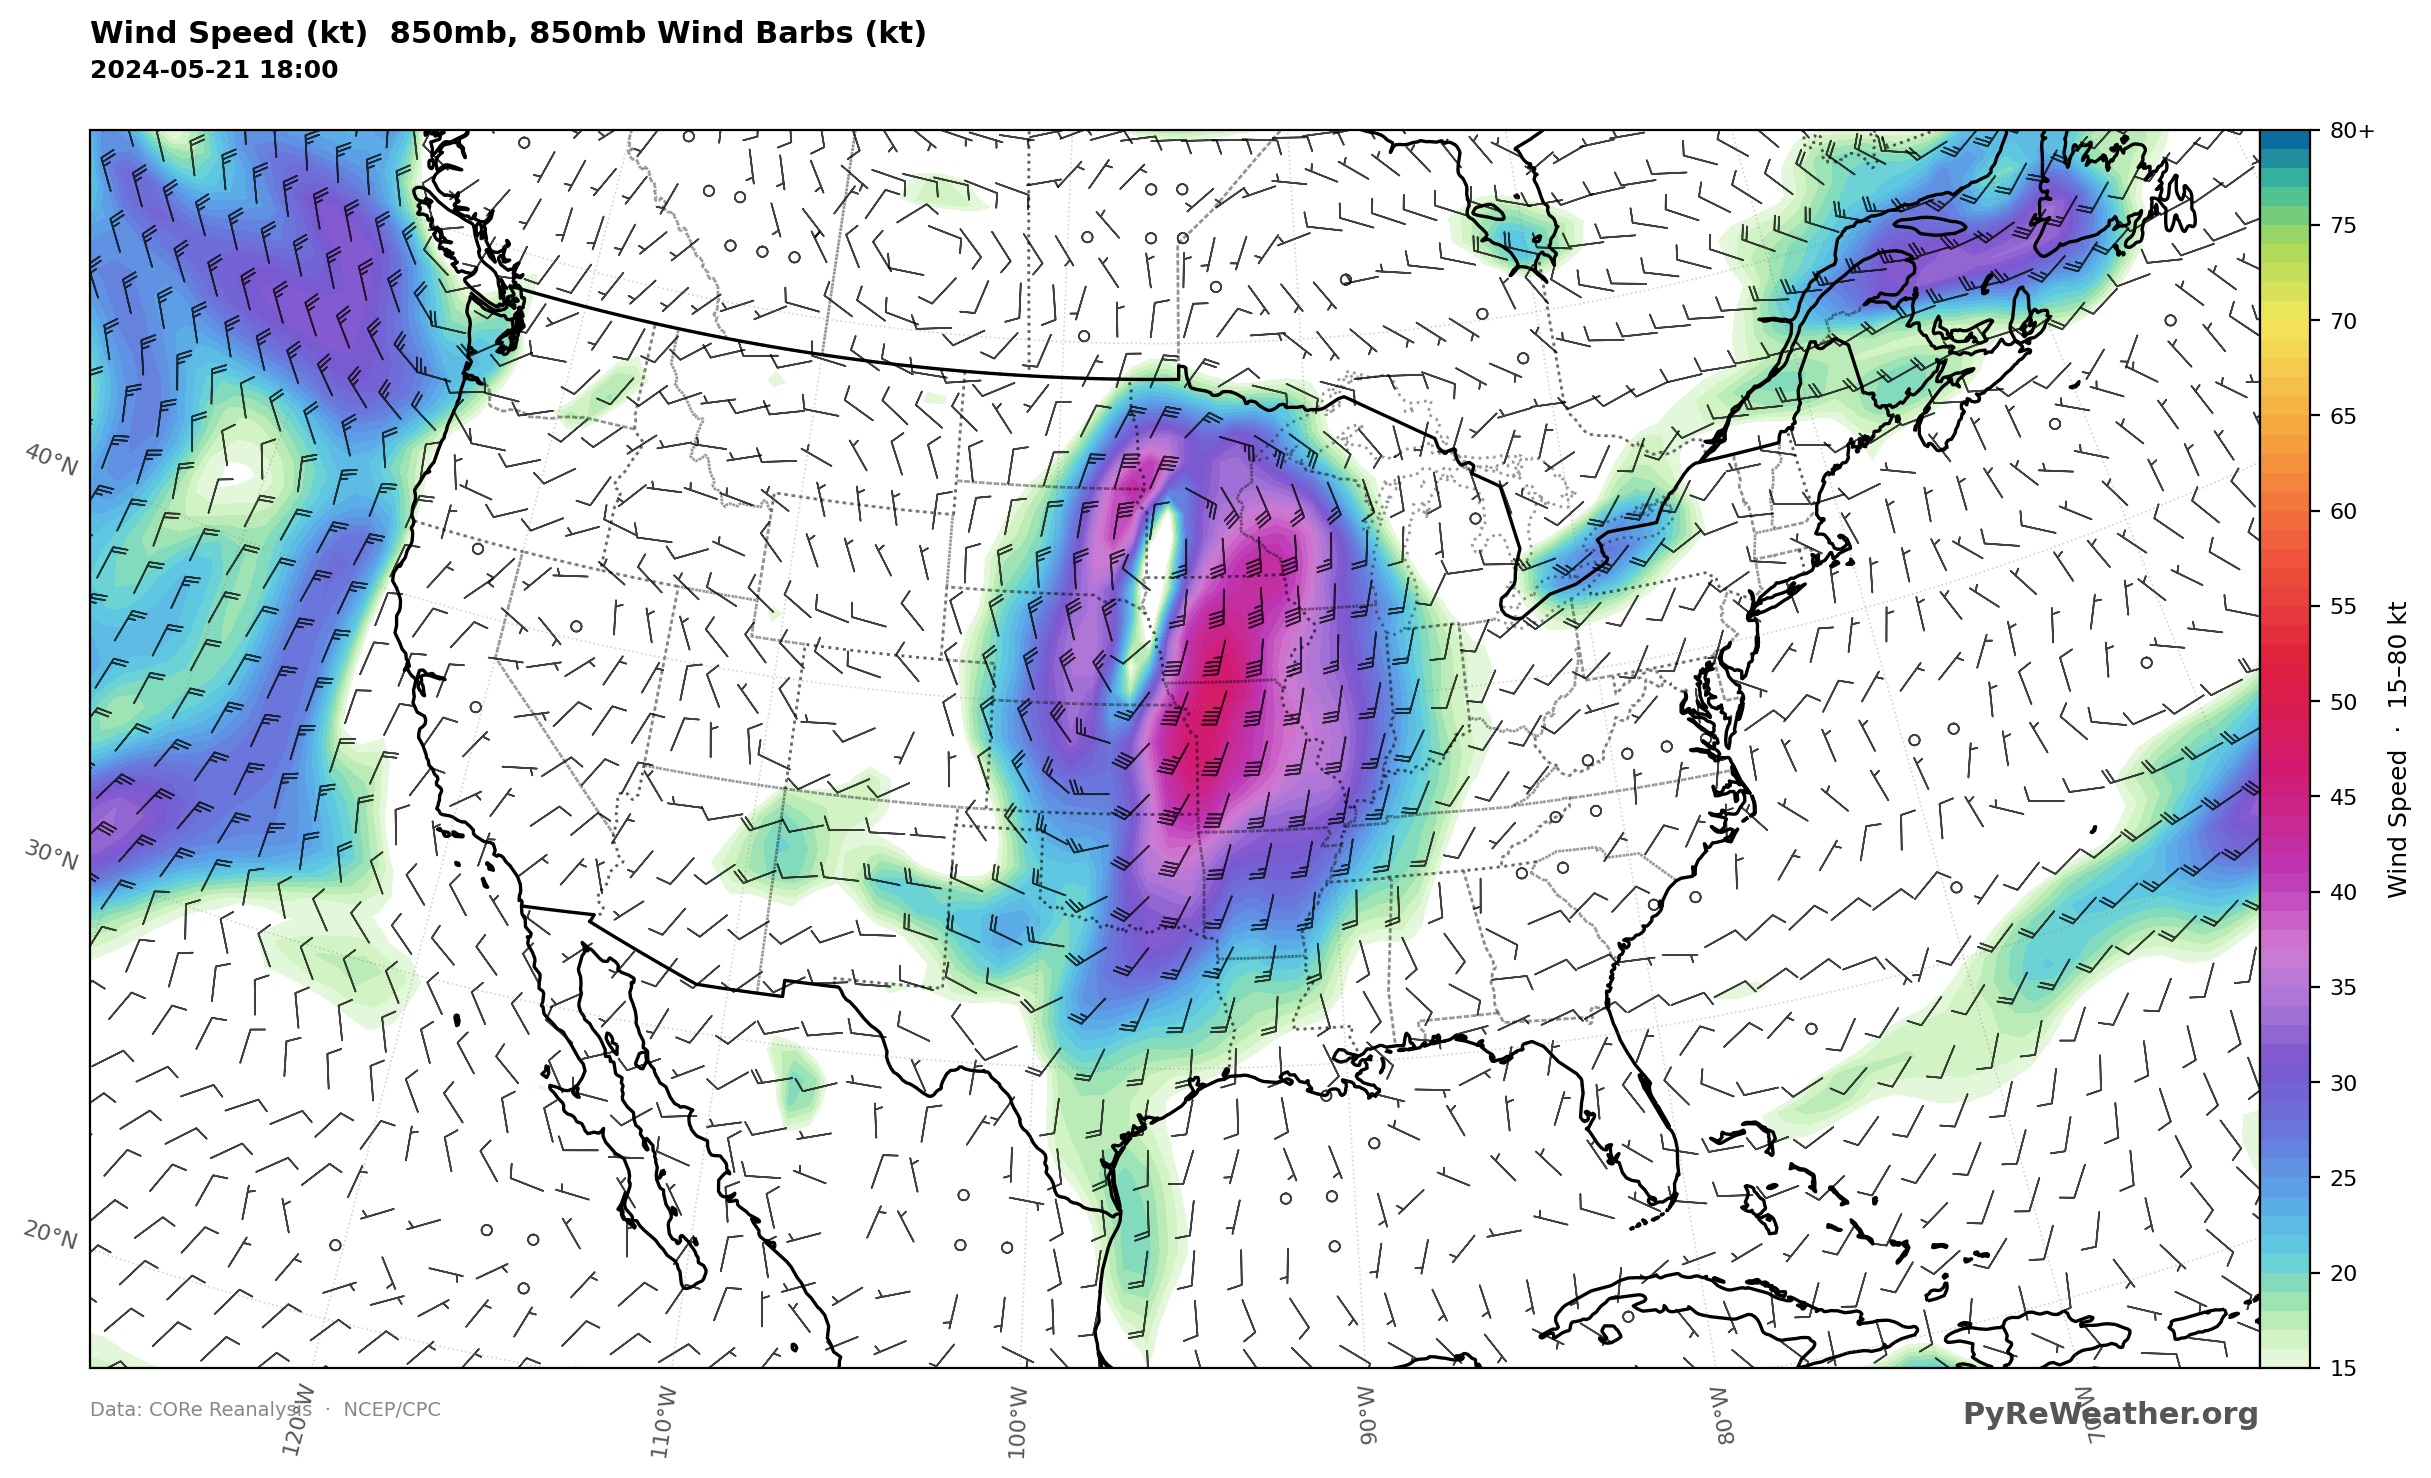
The winds are still generally coming from the south, but they're much faster - roughly 20 to 45 knots in this area. Already, comparing the surface winds with the winds at 850 mb gives us our first clue that the wind is changing with height.
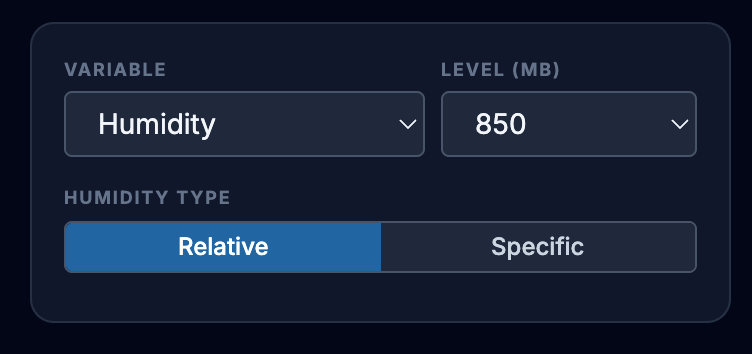
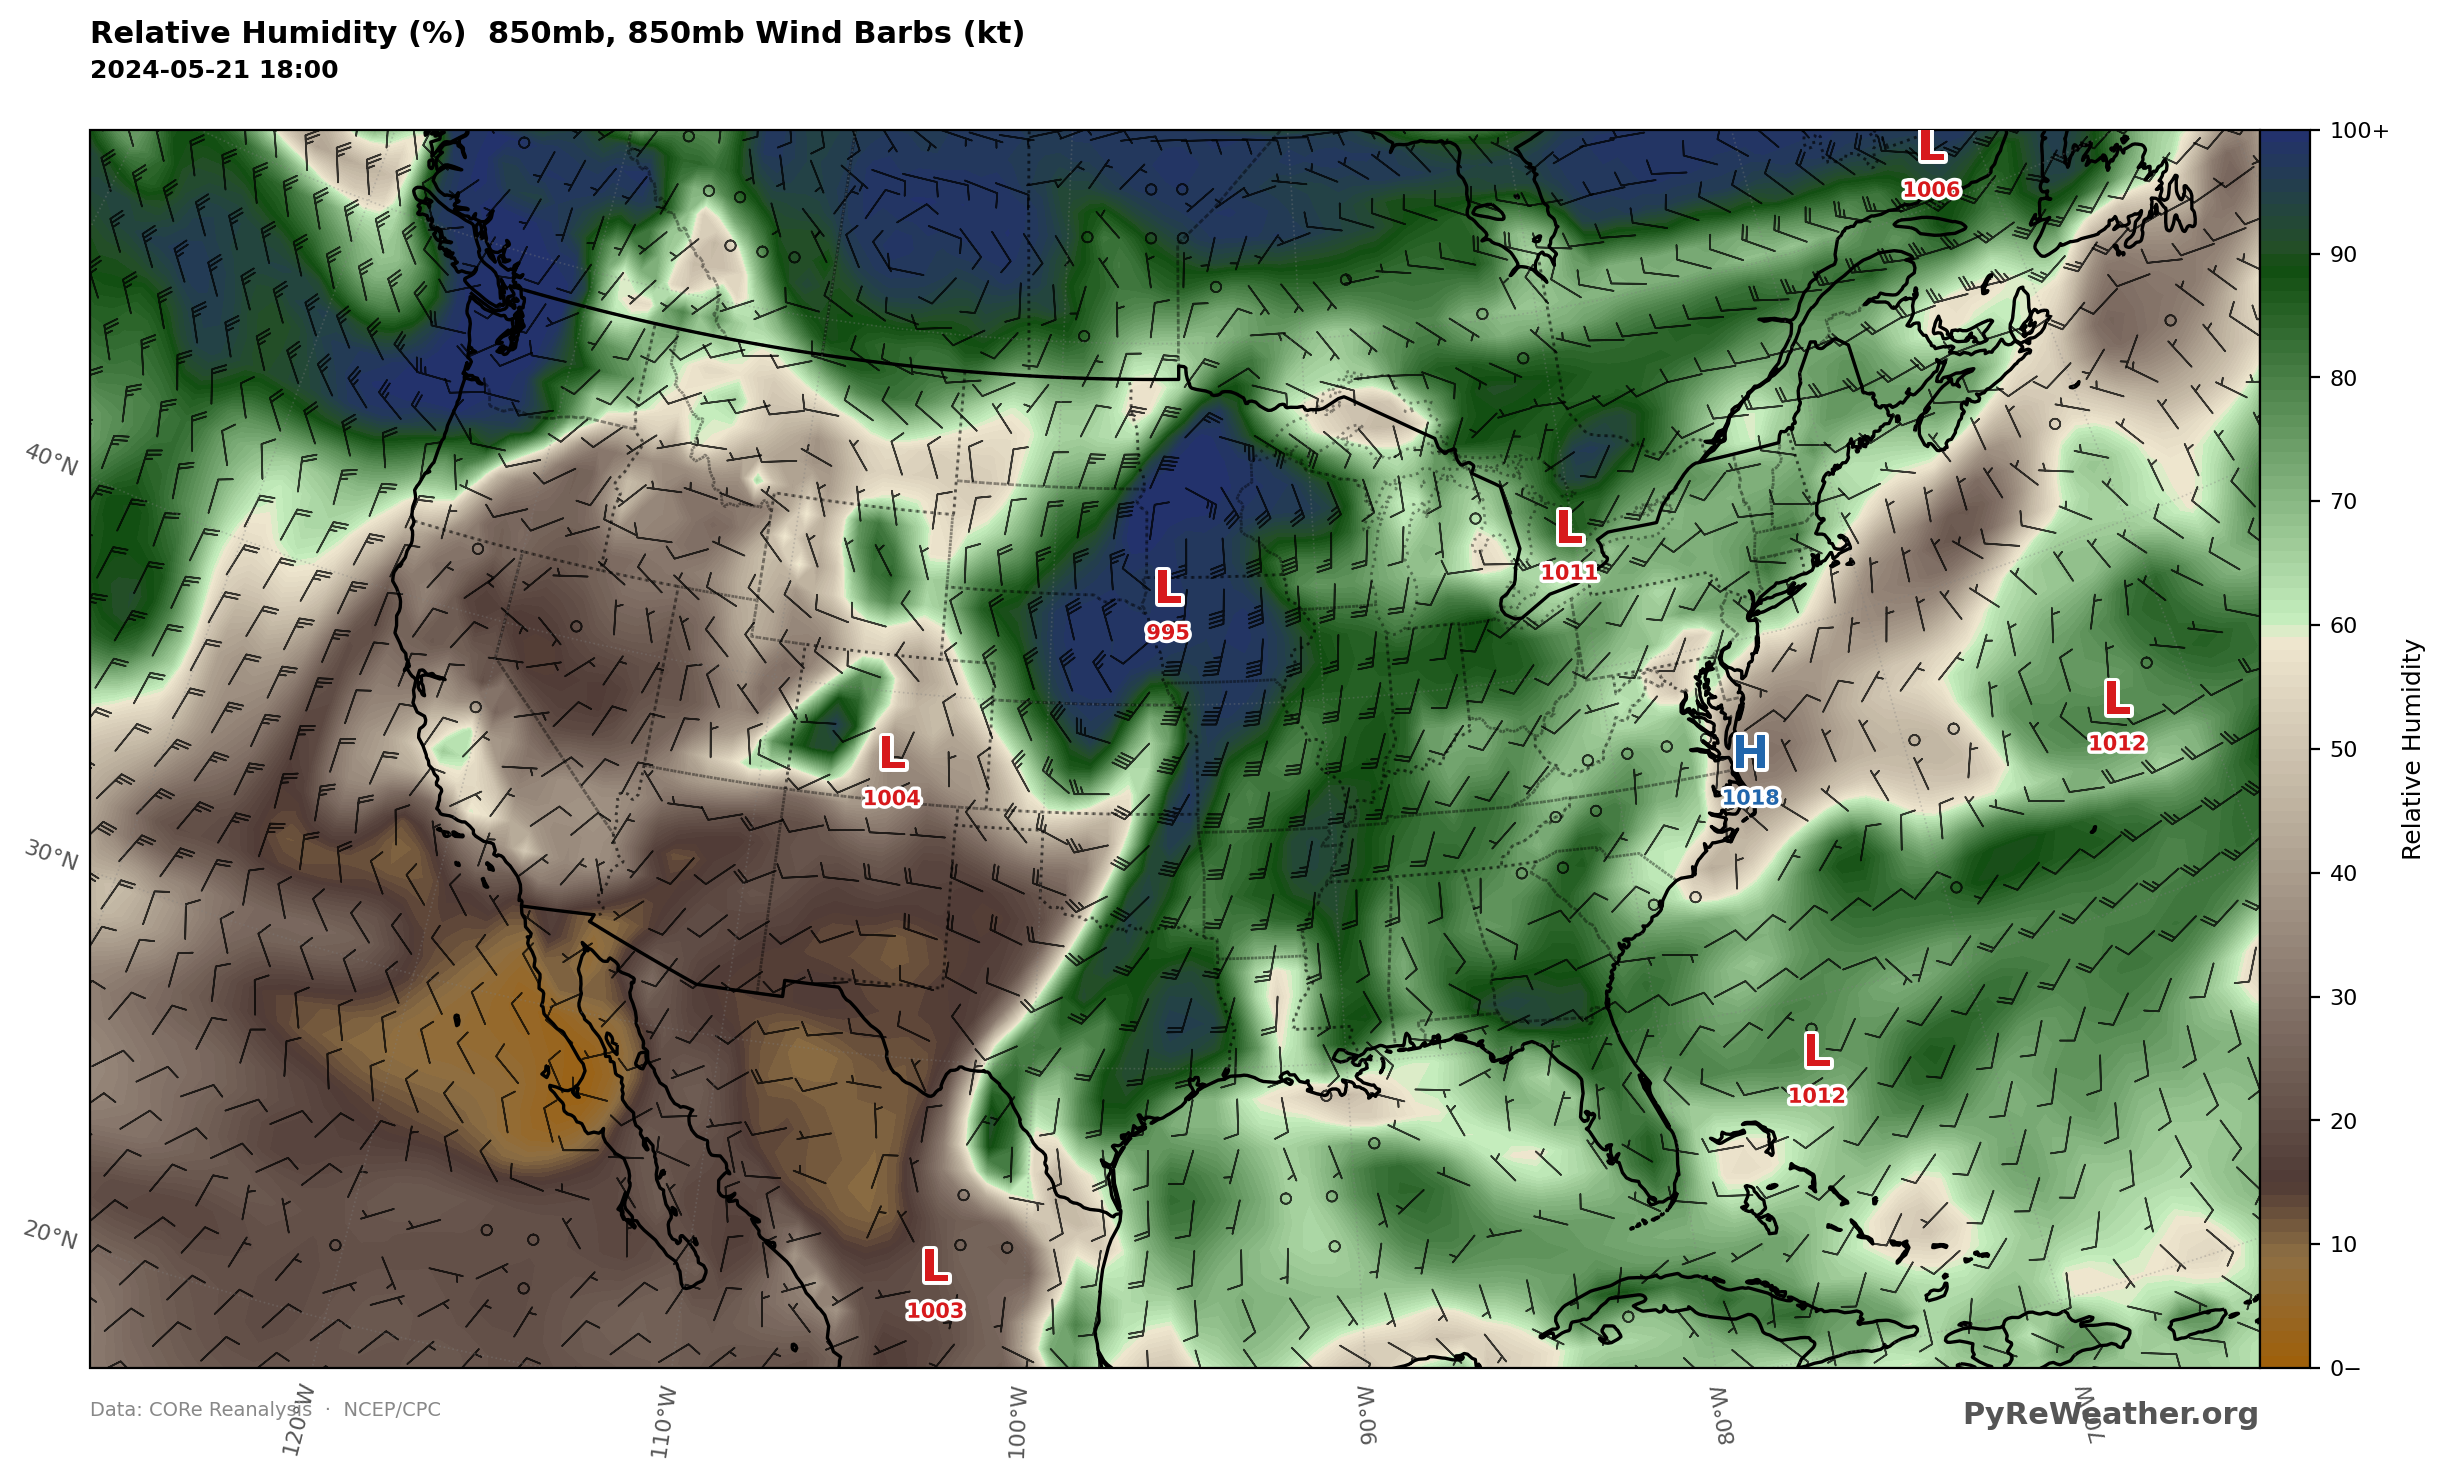
If you wanted to see the moisture being brought in by the low level jet, just change the variable selector to Humidity, and leave the level at 850mb.
Relative Humidity, 850mb, May 21, 2024, 18Z
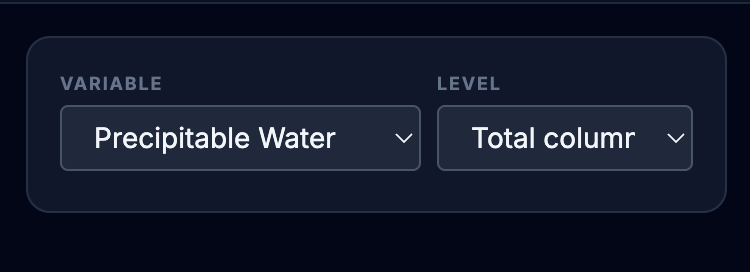
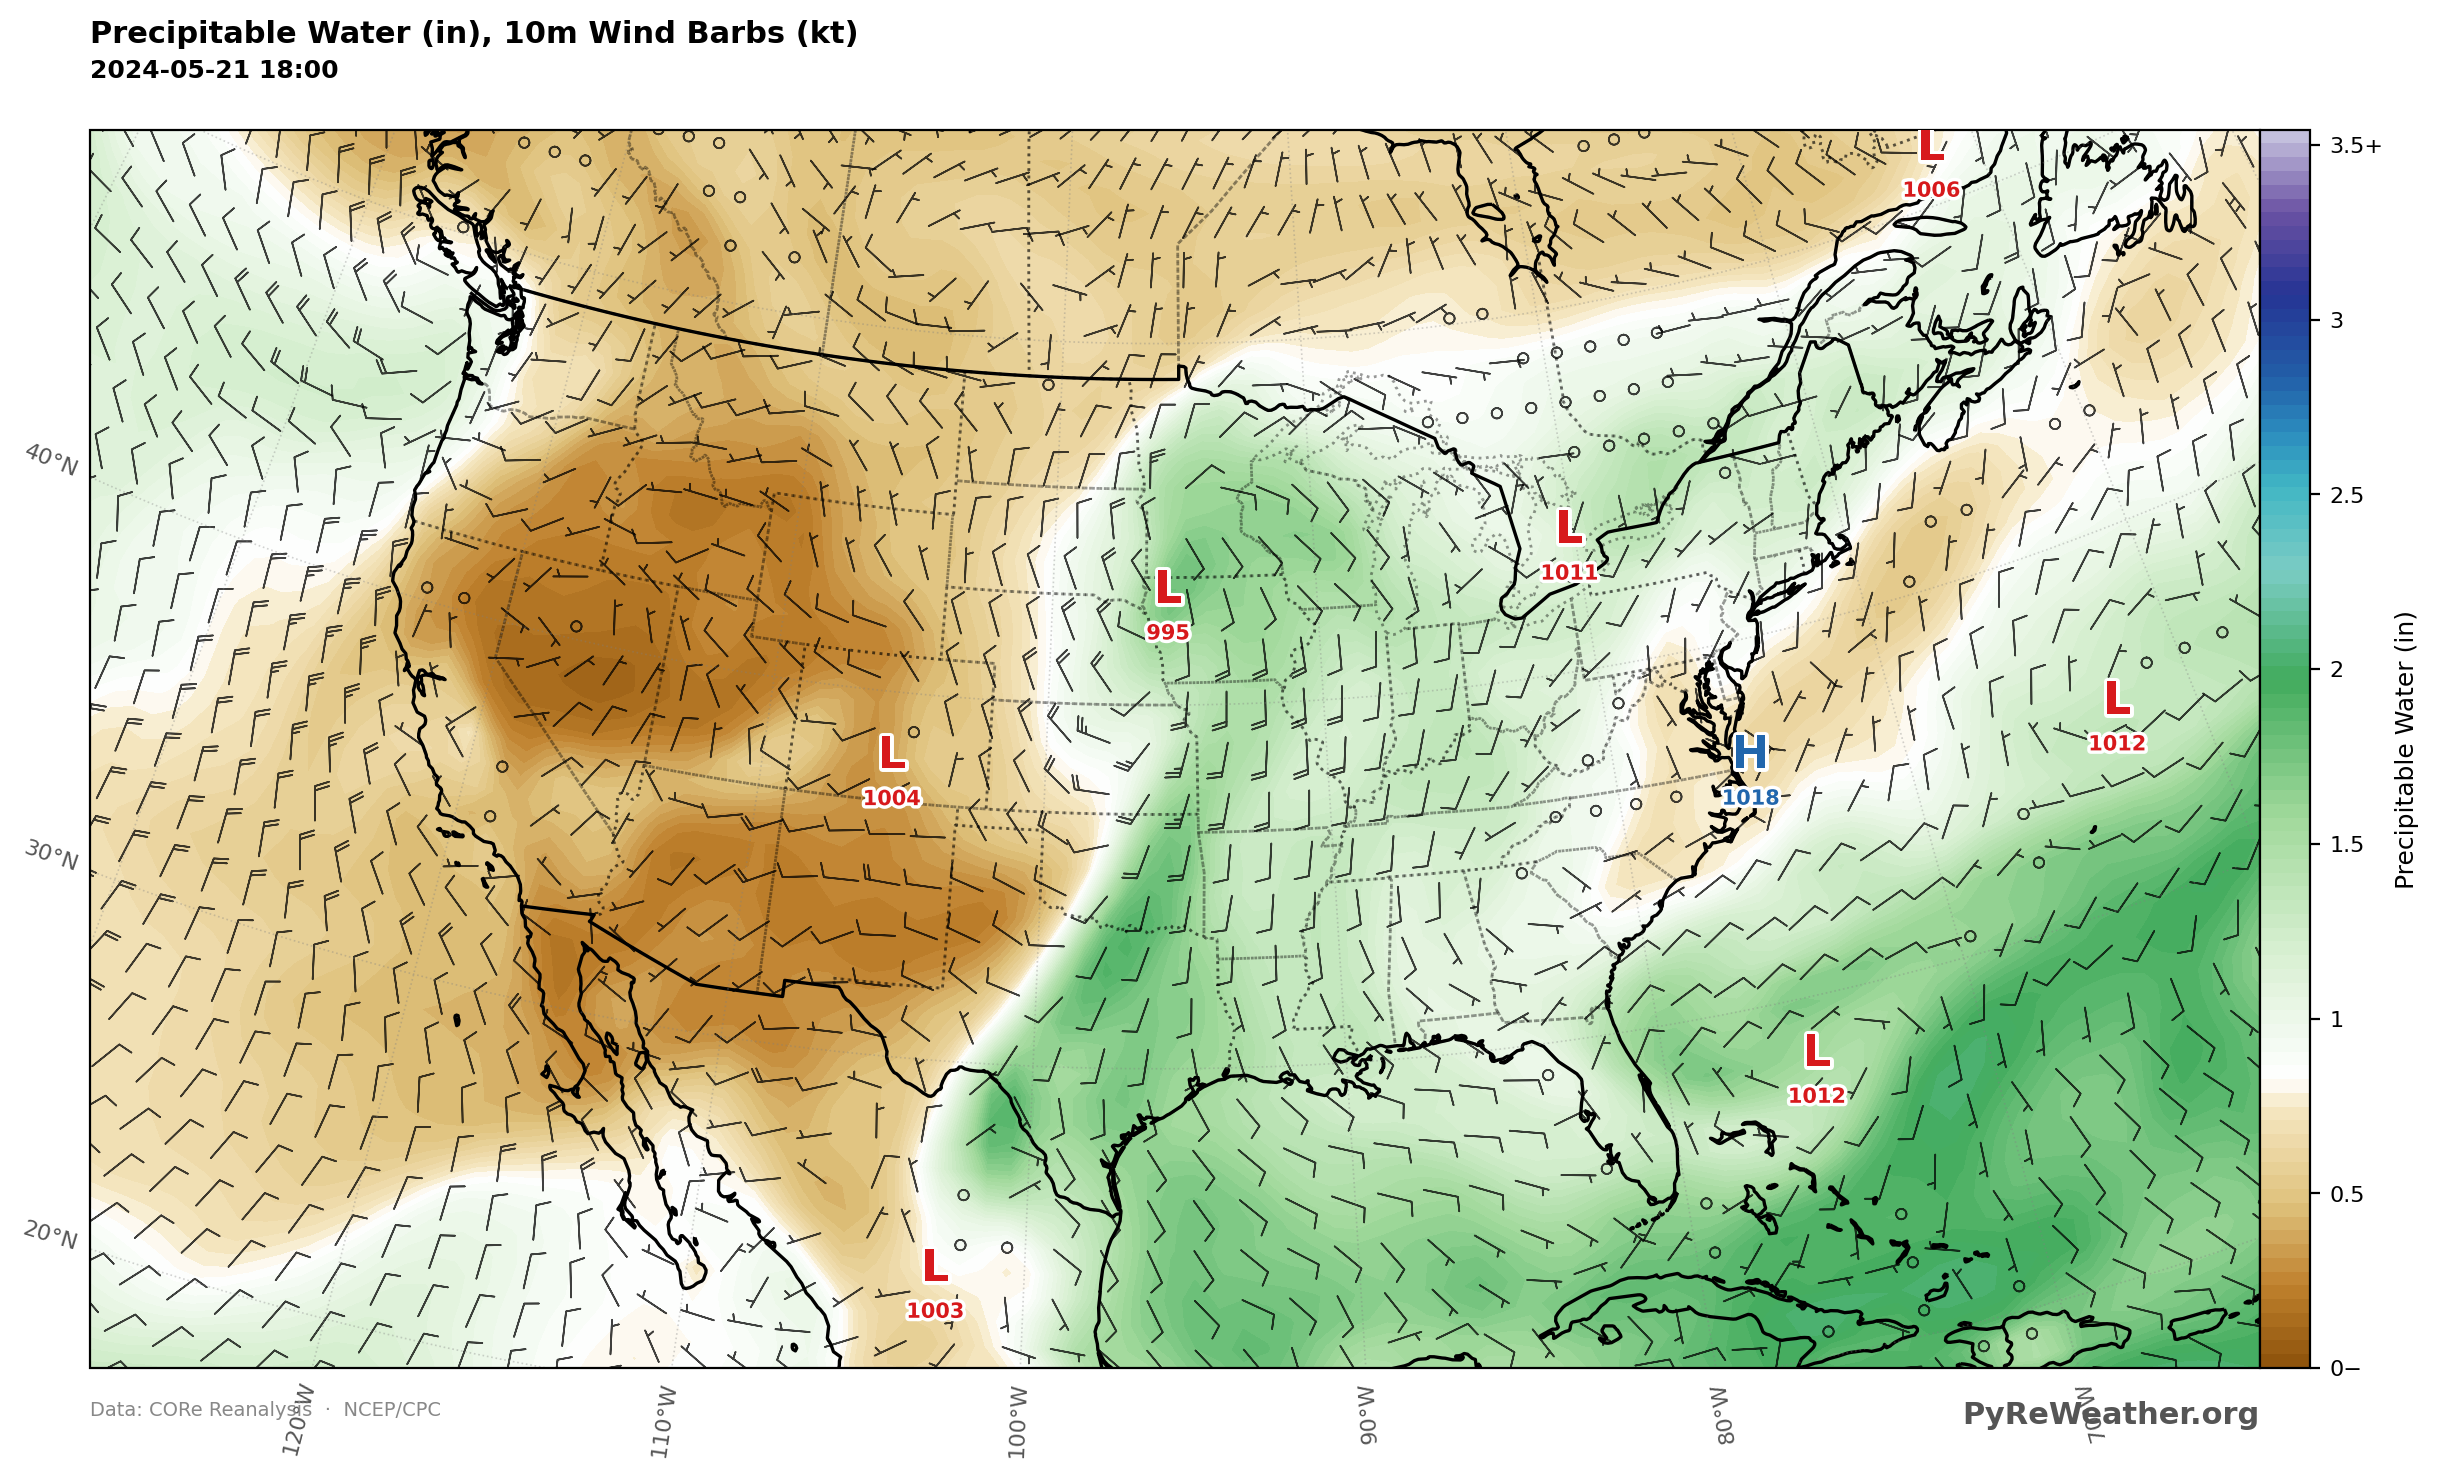
You may also want to see the total precipitable water in the atmospheric column instead. If so, select PWAT from the variable list. PWAT is total column, so there is no level to choose from, it will self adjust to Total Column.
Total Precipitable Water, May 21, 2024, 18Z
Wind Shear
That leads us to another important ingredient: wind shear.
Wind shear means that wind speed, wind direction, or both change as you move upward through the atmosphere. Strong shear helps thunderstorms organize and can support the rotating updrafts found in supercells, which are the storms responsible for most strong tornadoes.
We can look for clues to that changing wind field in PyRe by comparing winds at several different levels.
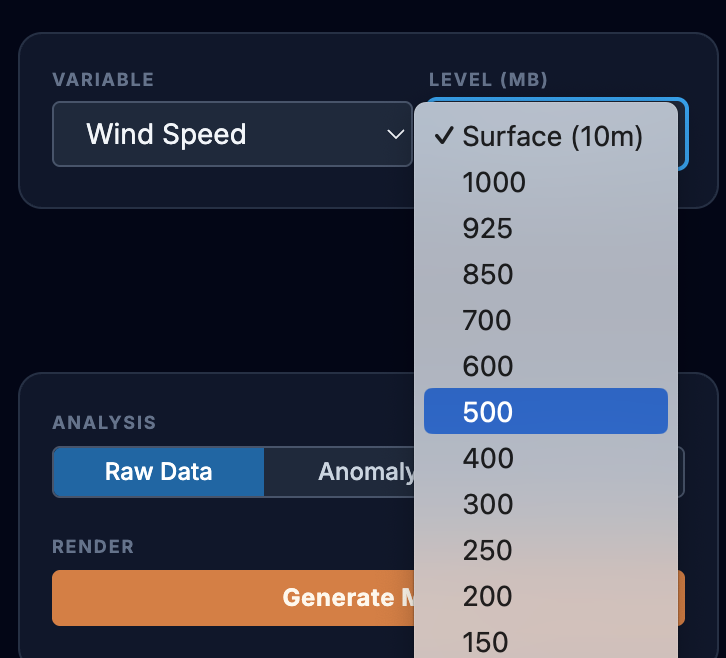
Select Wind Speed from the variable selector and 500 mb from the level selector, then click Generate Map.
Wind Speed 500mb, May 21, 2024, 18Z
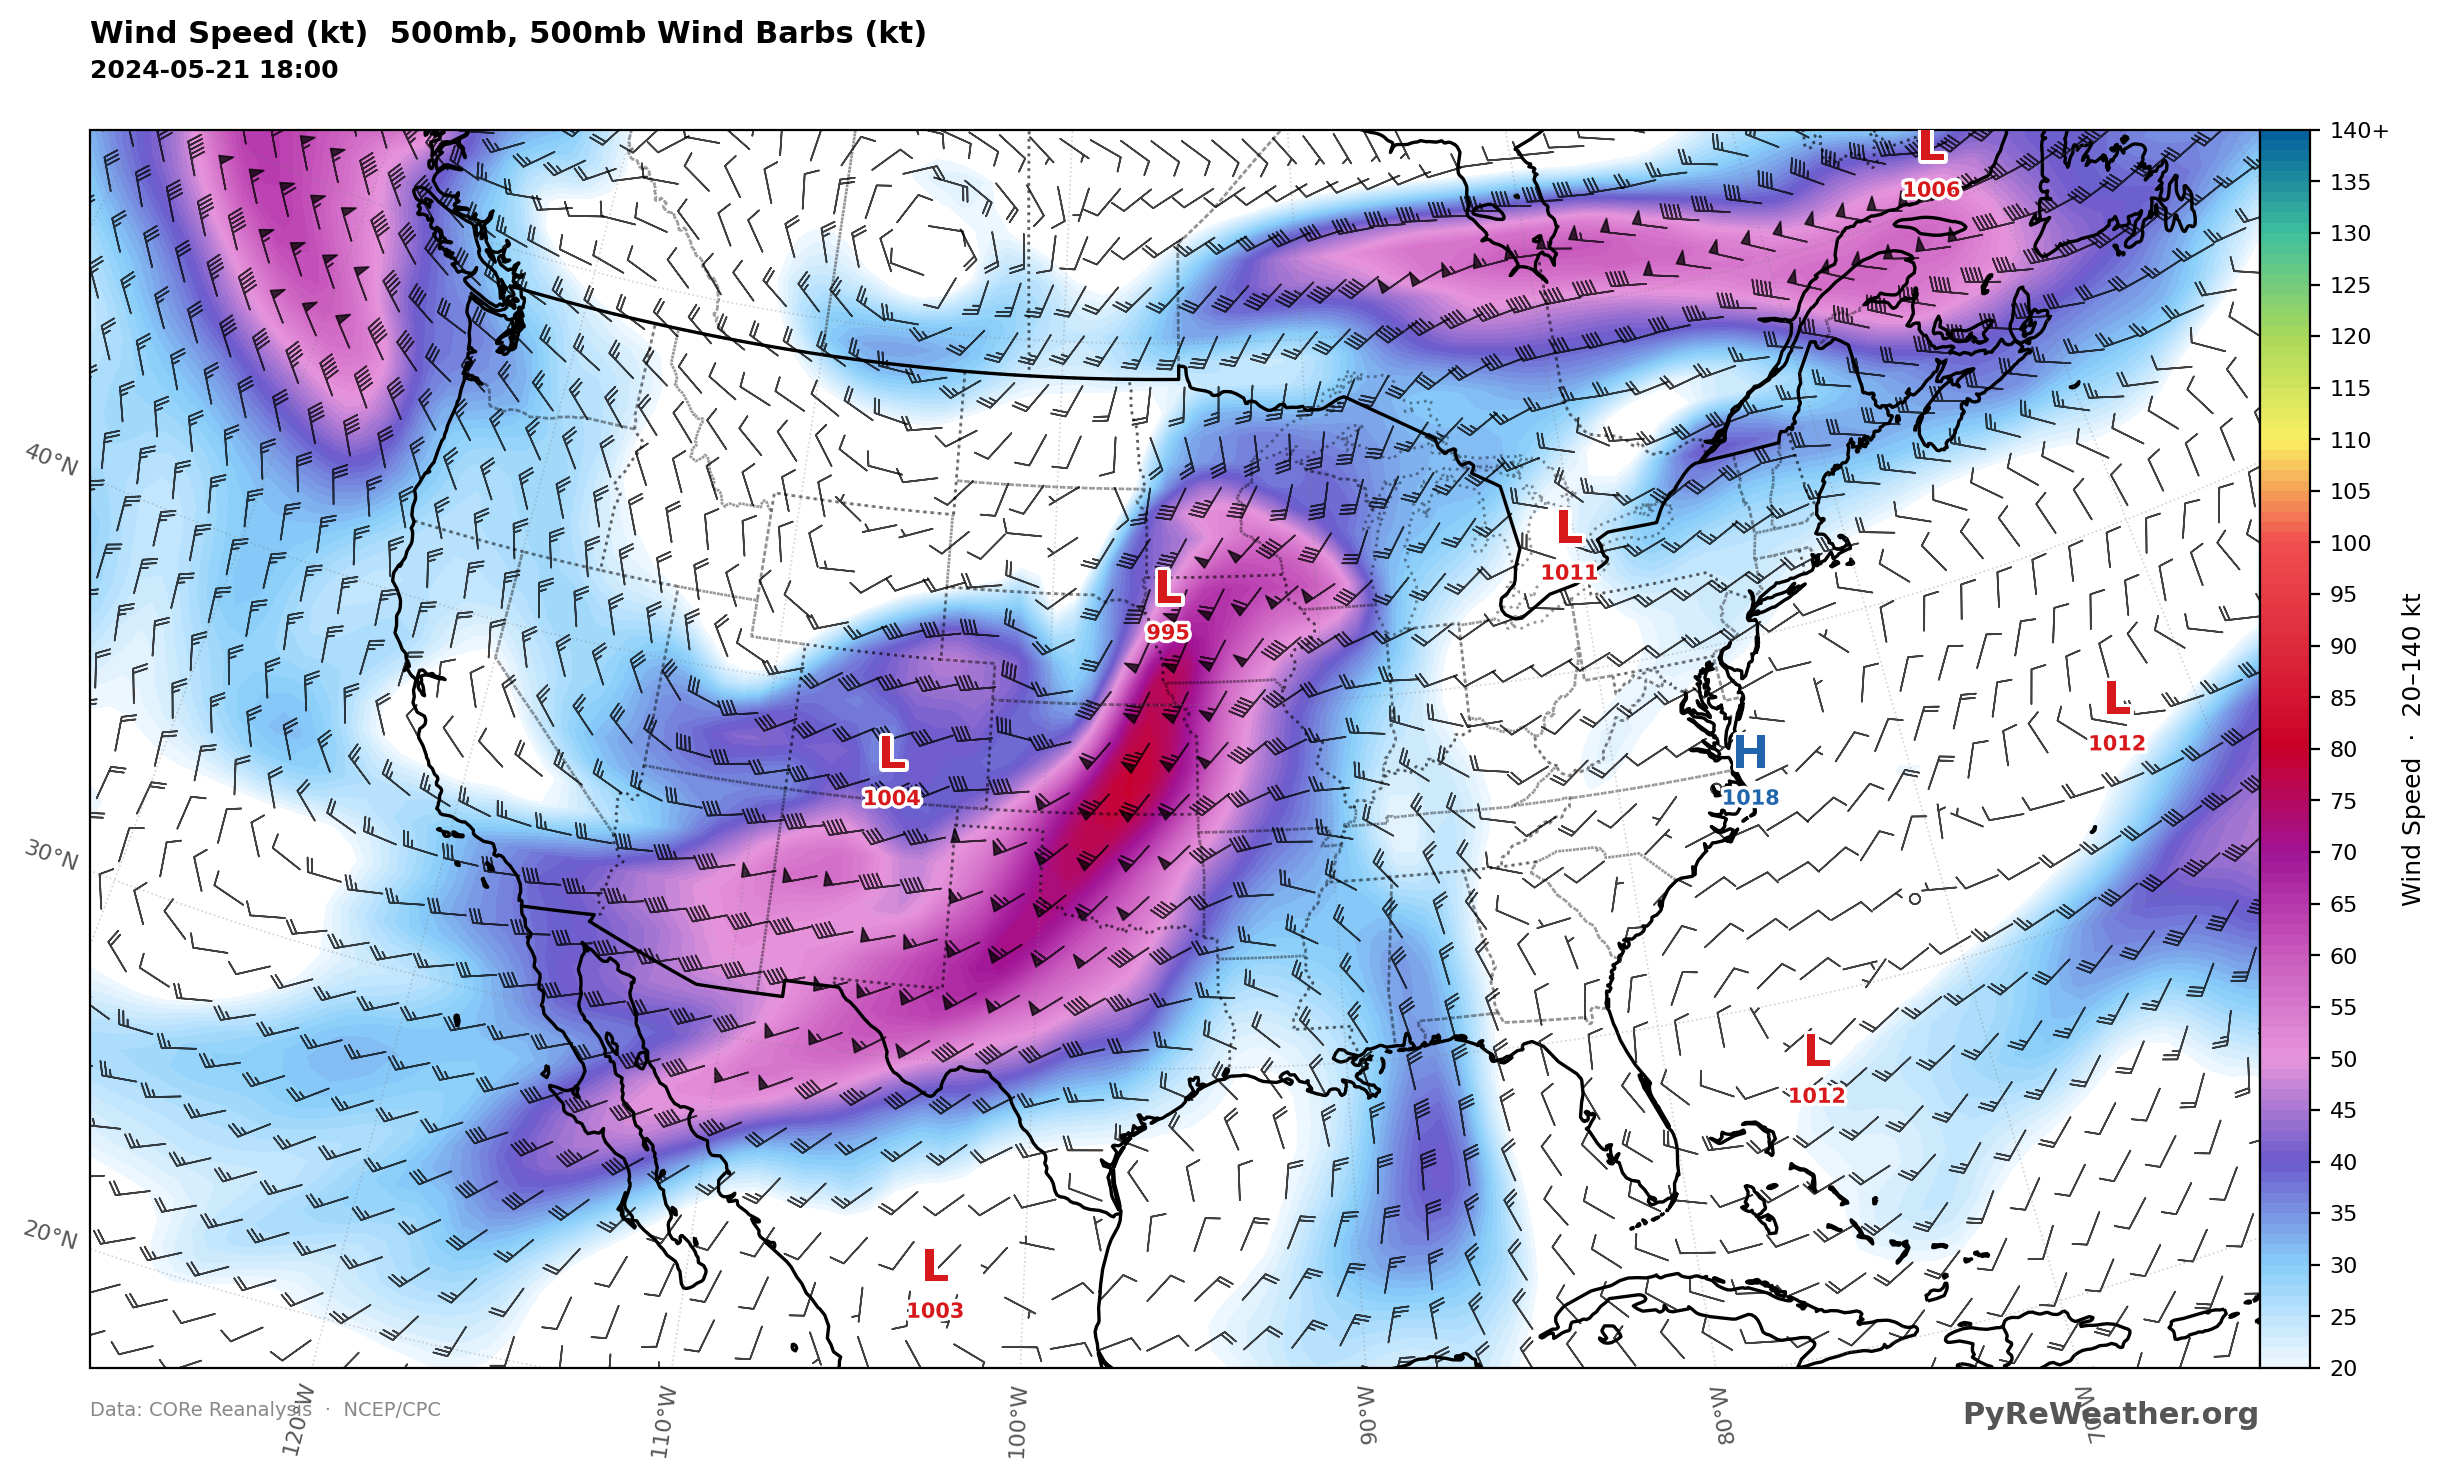
There is a lot going on here.
Can you pick out the area with the strongest winds? I see winds approaching 85 knots over eastern Nebraska, heading toward Iowa.
Compare that with the much weaker winds we just saw near the surface. The wind has become dramatically stronger with height, and its direction has changed as well.
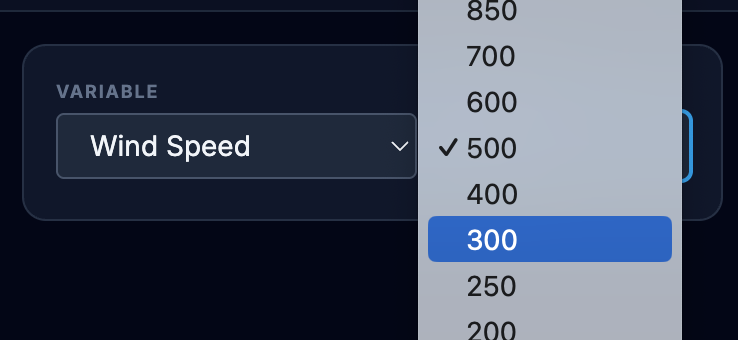
Now change the level to 300 mb and generate another map.
Wind Speed 300mb, May 21, 2024, 18Z
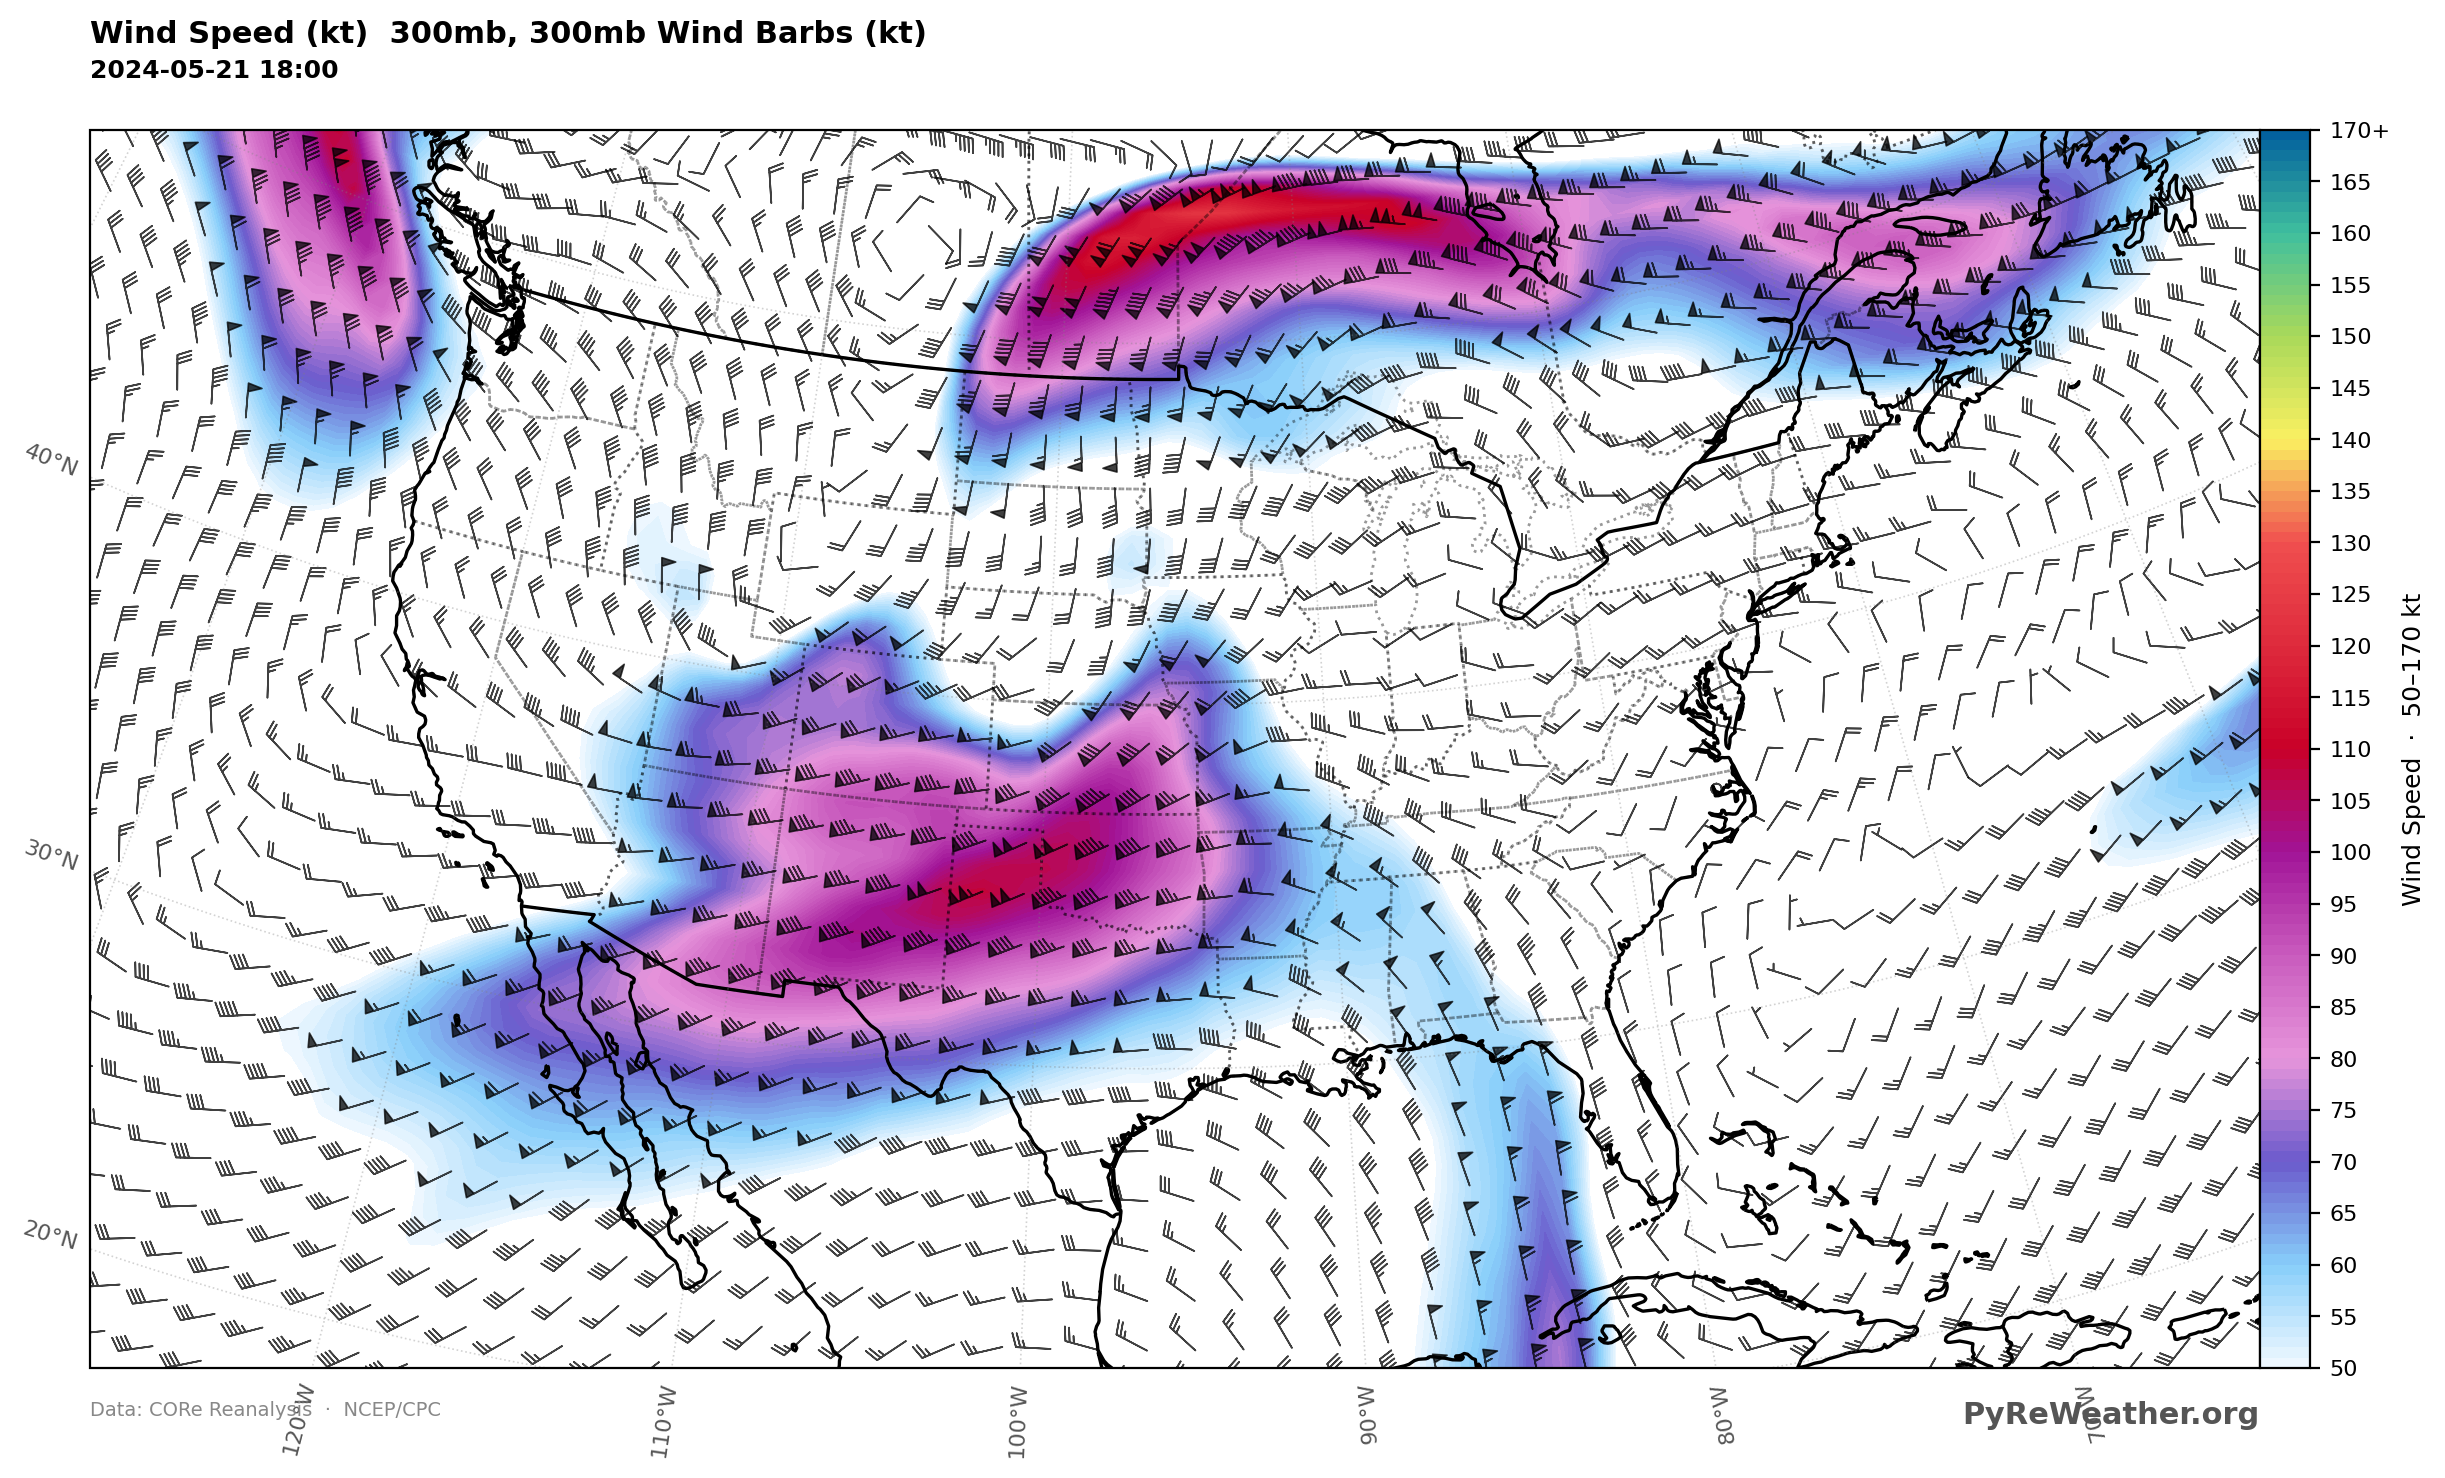
There are winds near 100 knots over the southern Plains.
At this point, we've looked from the ground nearly to the top of the troposphere, and the changing wind field is hard to miss.
Instability
For thunderstorms to form, moisture and wind shear aren't enough. We also need an atmosphere that allows rising air to keep rising.
One way meteorologists measure that potential is CAPE: Convective Available Potential Energy.
Select CAPE from the variable dropdown. PyRe offers several CAPE calculations. For this exercise, try one and take a look at what was happening over Iowa and Nebraska that afternoon.
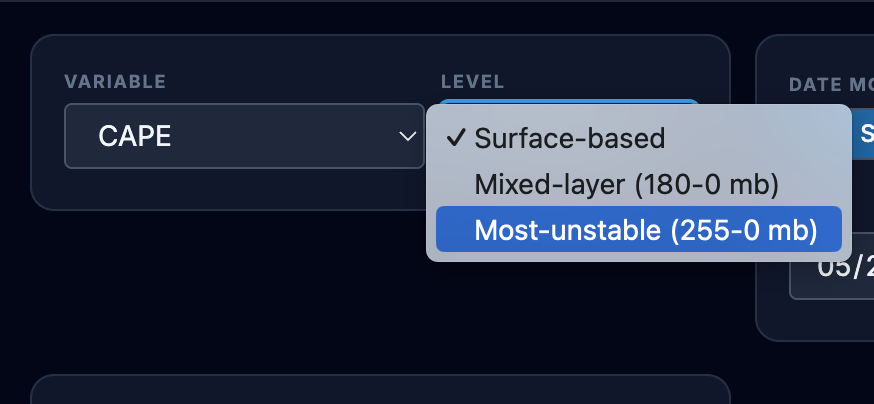
Most Unstable Cape (255-0mb), May 21, 2024, 18Z
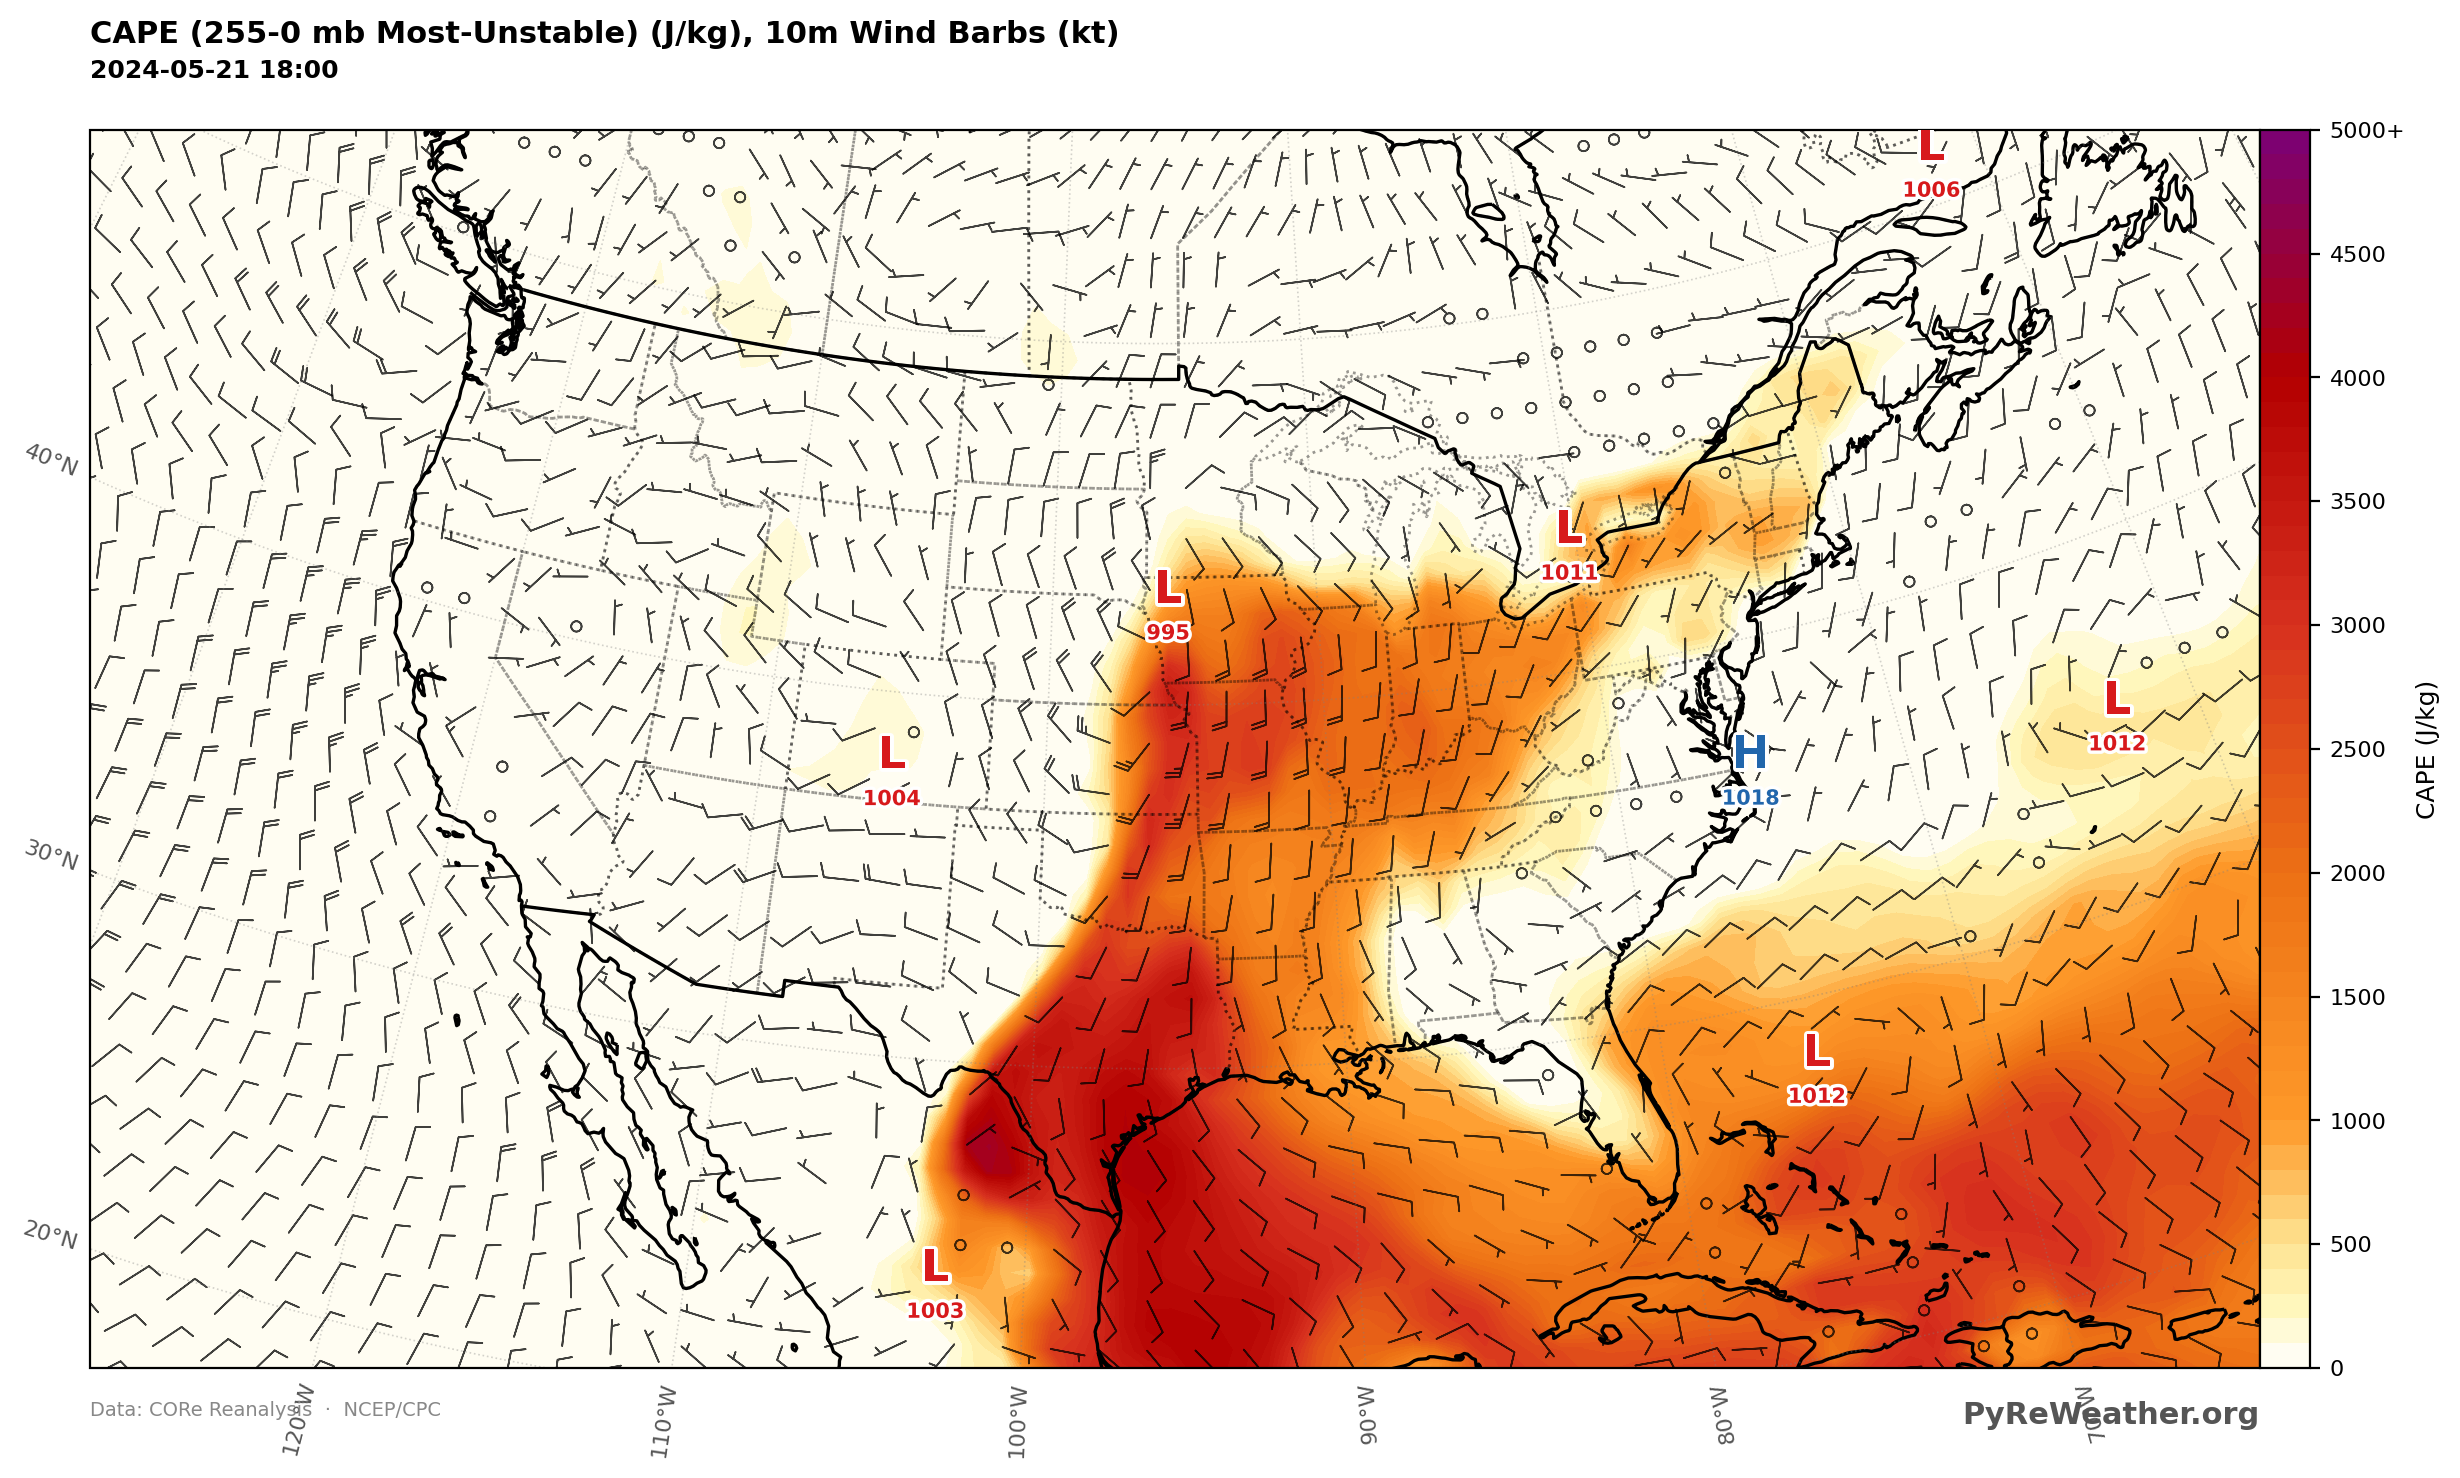
You can see a sharp boundary in the instability, with CAPE near eastern Nebraska and western Iowa approaching 3000 J/kg.
That is a very unstable atmosphere. If air can be lifted and remain warmer and more buoyant than the air around it, it can accelerate upward and feed rapidly growing thunderstorms.
Rising Air
Now we need something to get that air moving upward in the first place.
On this day, there were several mechanisms helping that happen.
The first is the cold front we could already see in the surface temperature pattern. As denser cold air advances, it can force warm, moist air ahead of it upward.
But there was also plenty happening higher in the atmosphere.
Select Geopotential Height from the variable dropdown and 500 mb from the level selector. You can choose either Contours or Shading. Shading is prettier; contours can make the pattern easier to see. Try both.
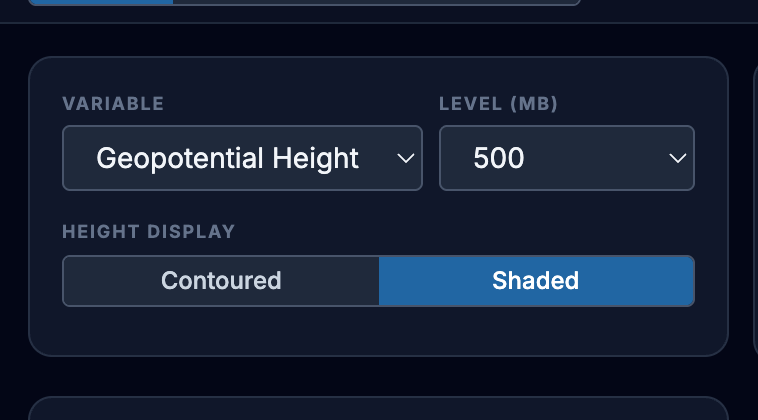
Geopotential Height, May 21, 2024, 18Z
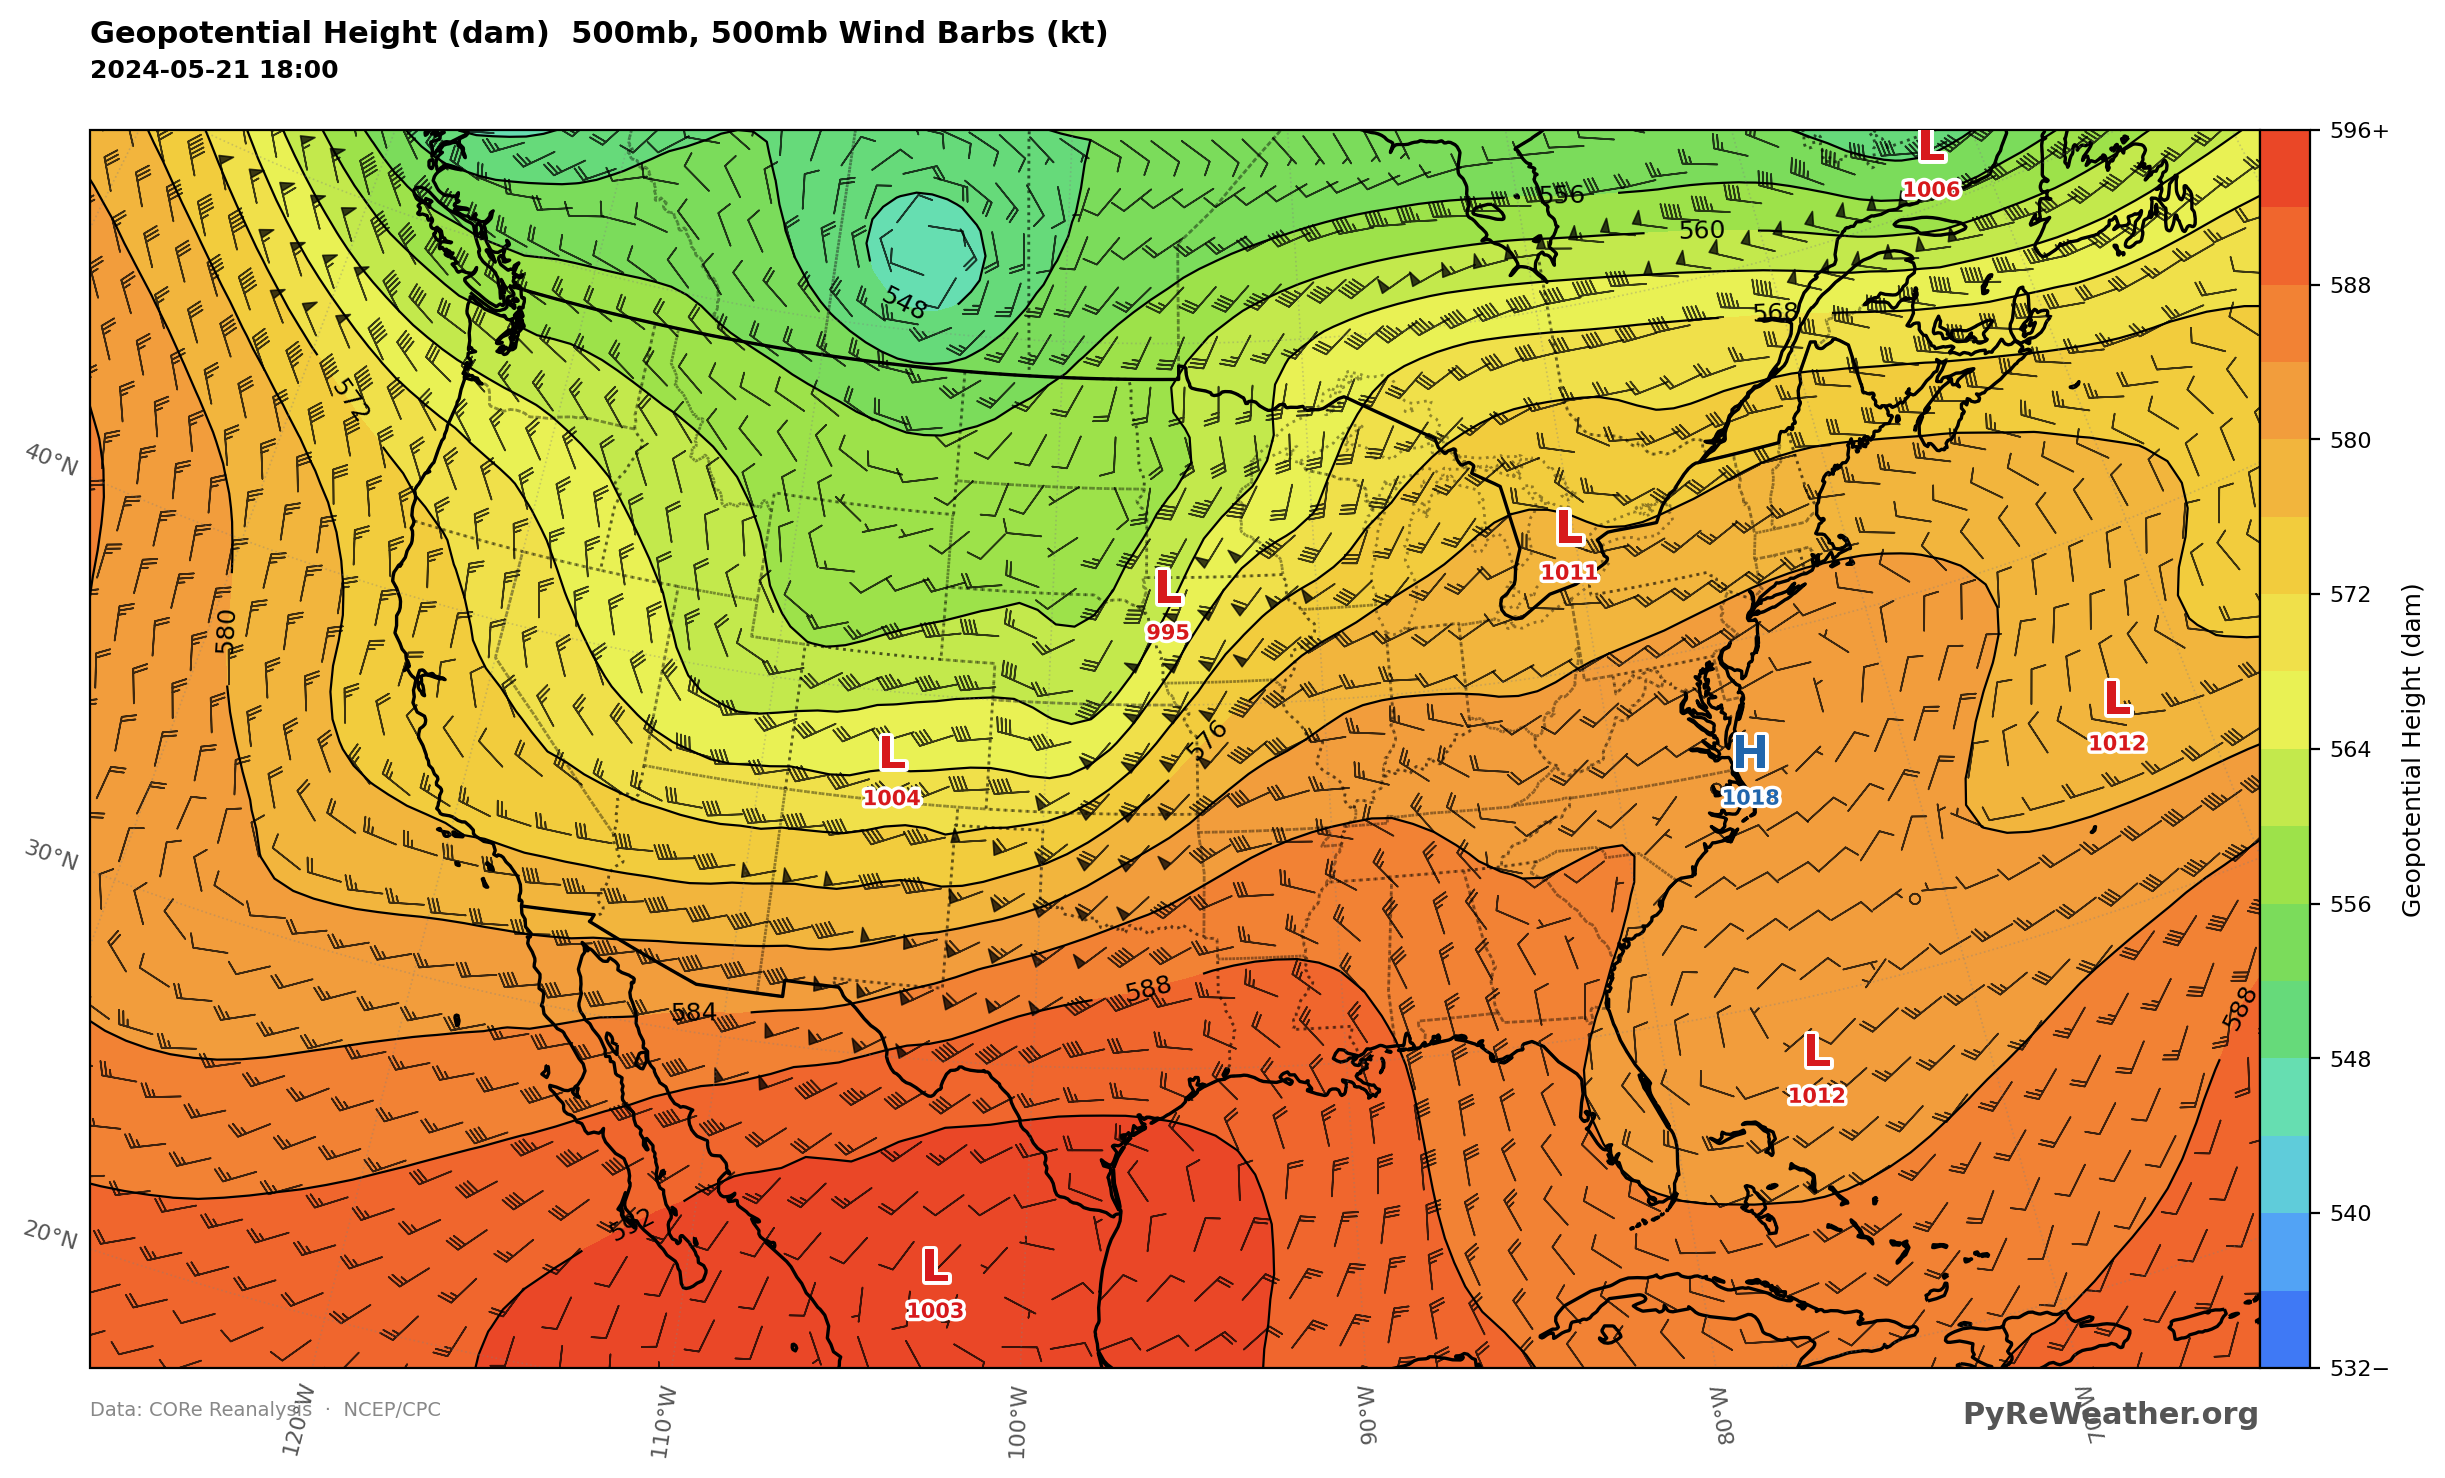
At 500 mb, you can see the broad trough over the western United States along with smaller disturbances moving around it.
These upper-level disturbances can help promote rising motion downstream as the atmosphere responds to the changing flow aloft.
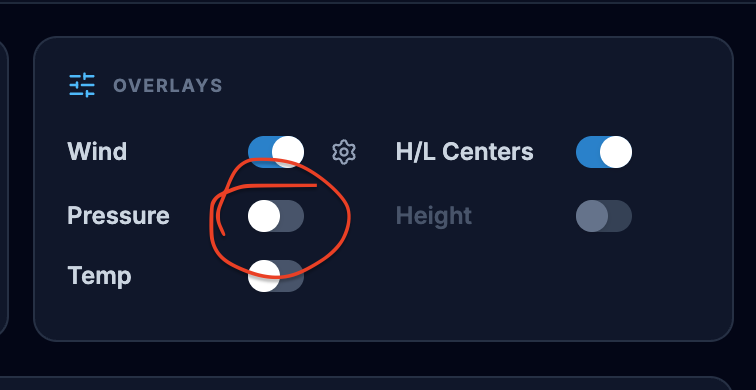
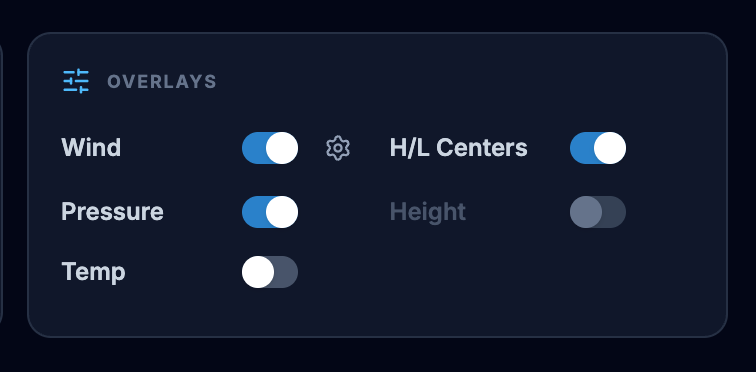
Now overlay surface Pressure on the 500 mb height contours, by clicking the Pressure toggle. (Note that Pressure only overlays surface pressure. If you're thinking you want to add upper level "pressure" instead you would select the Height). In this case since the base map is already Geopotential Height, that option is not available.
Geopotential Height, 500mb with MSLP and High/Low Centers May 21, 2024, 18Z
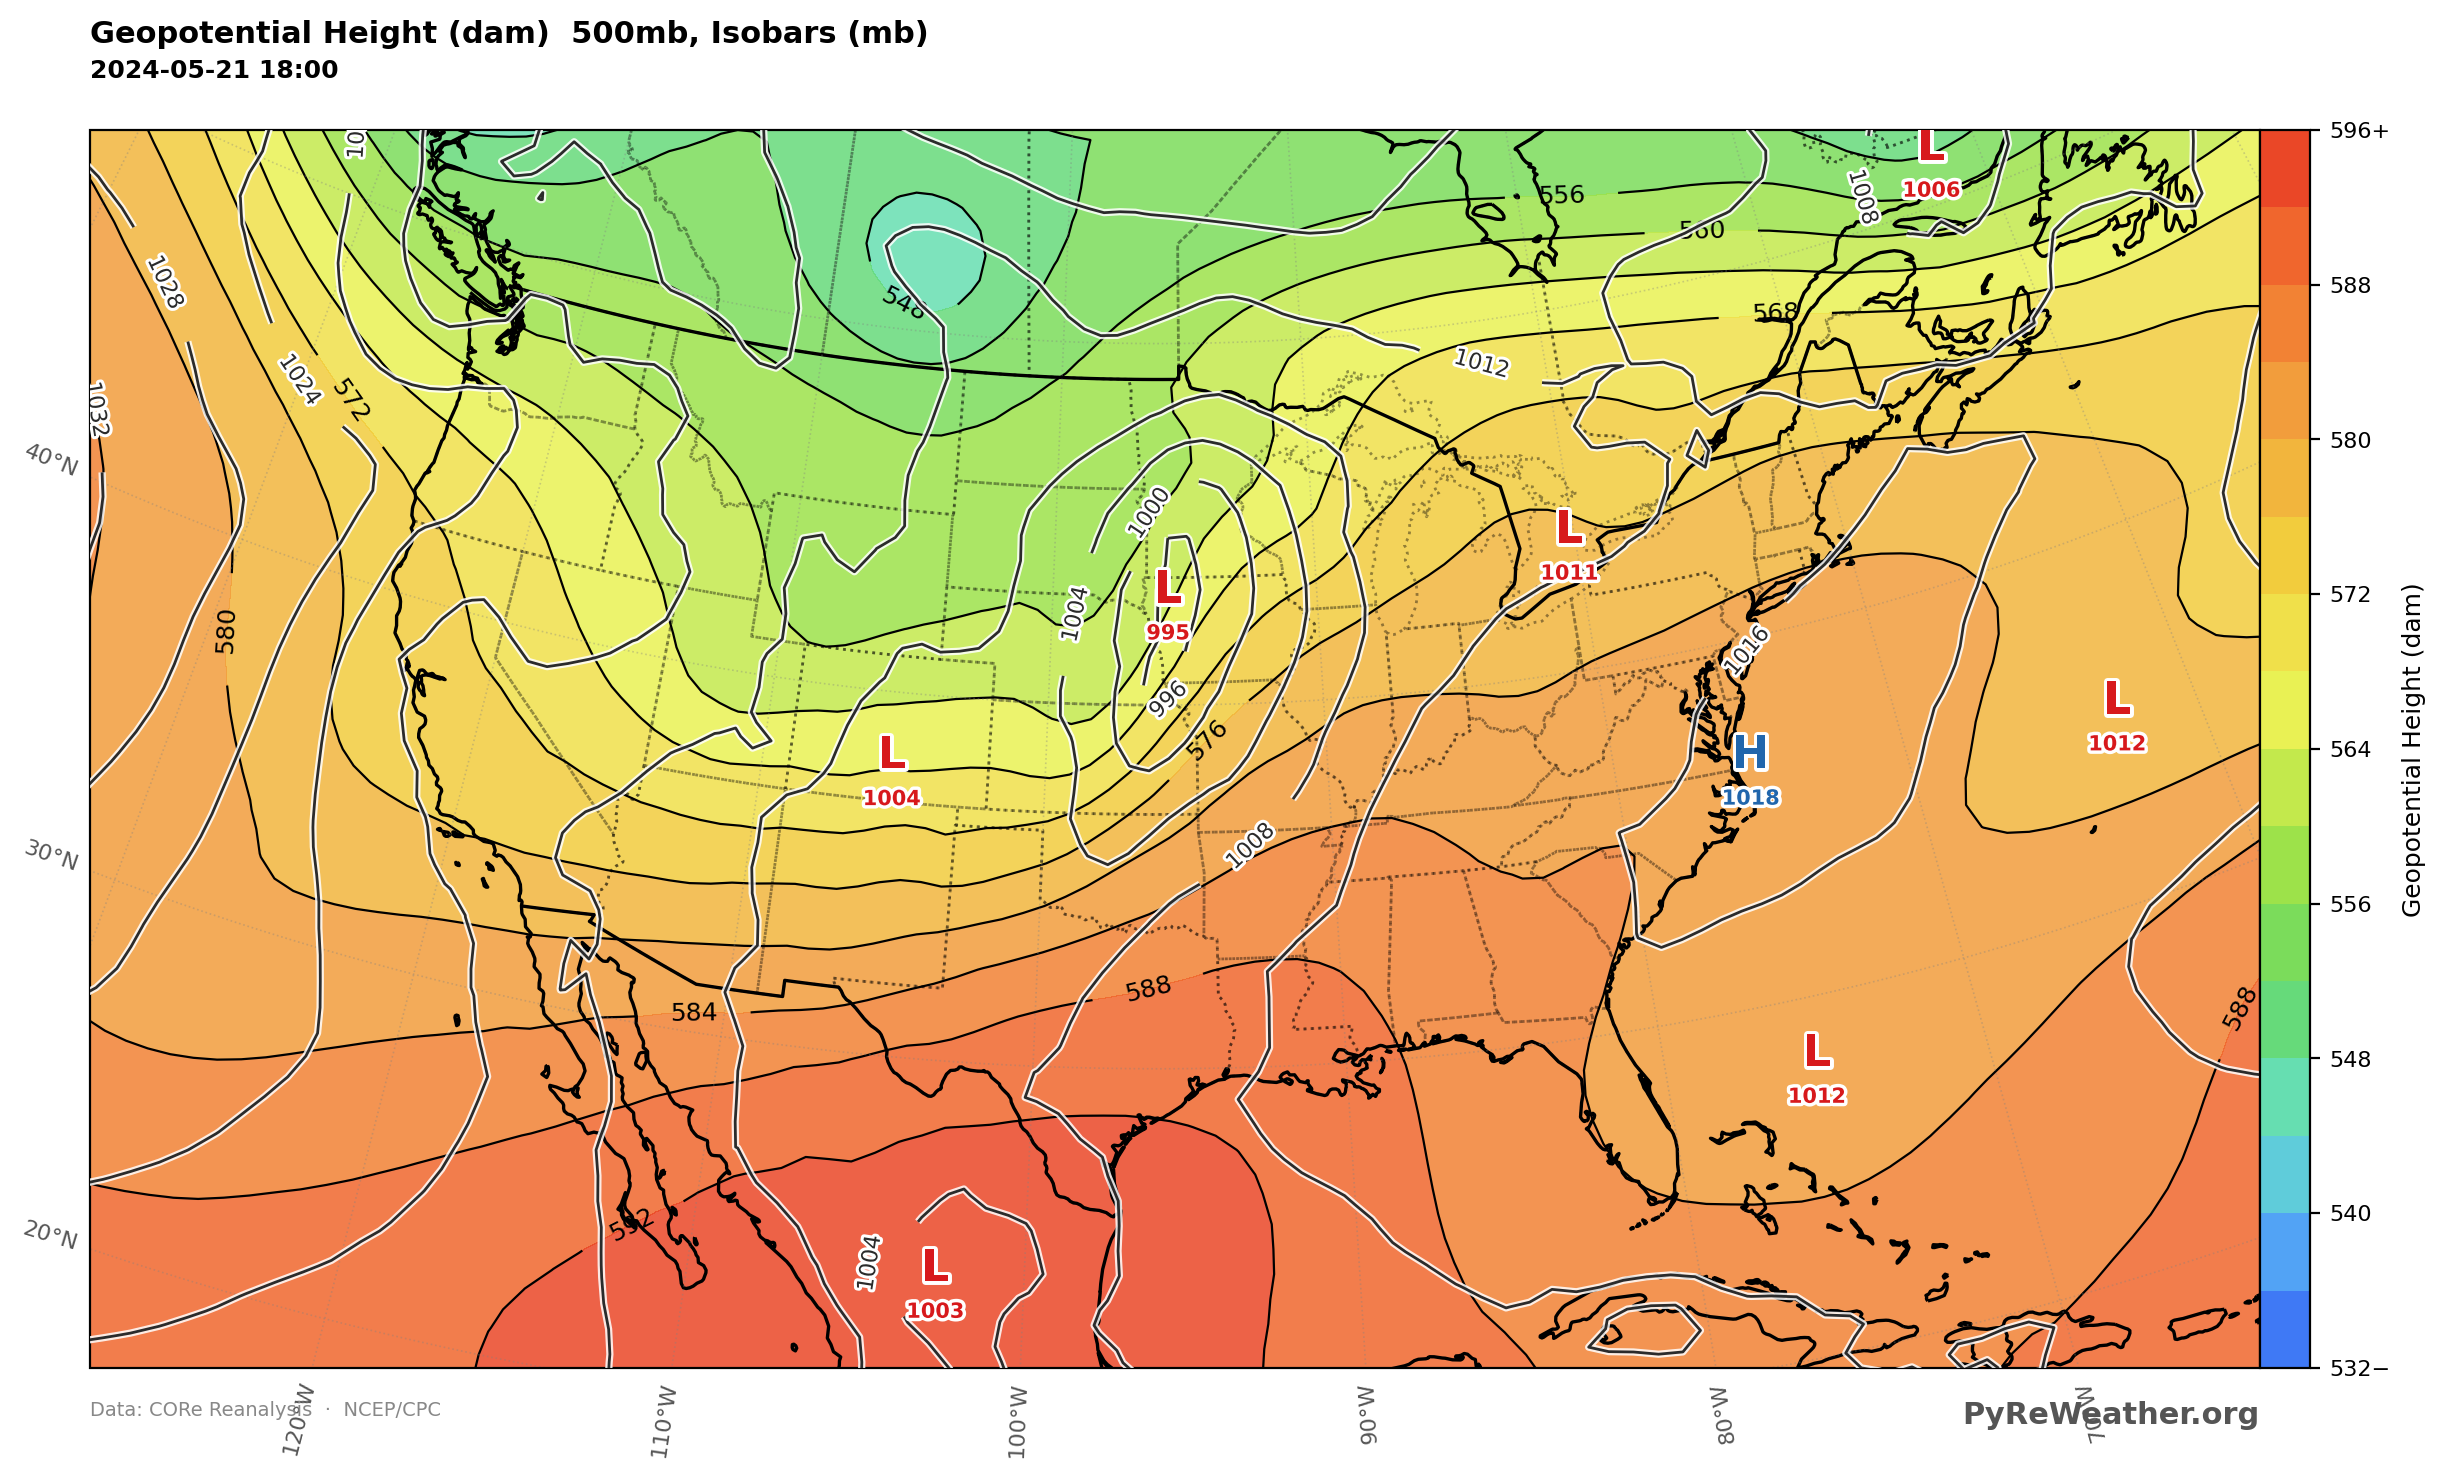
Notice how the surface low is displaced east of the upper-level trough and the shorter wave embedded within it?
That vertical structure is characteristic of a developing mid-latitude cyclone. Add in the warm, moisture-rich air, strong instability, powerful winds aloft, and an advancing cold front, and you can start to see why the atmosphere over Iowa was capable of producing such violent storms.
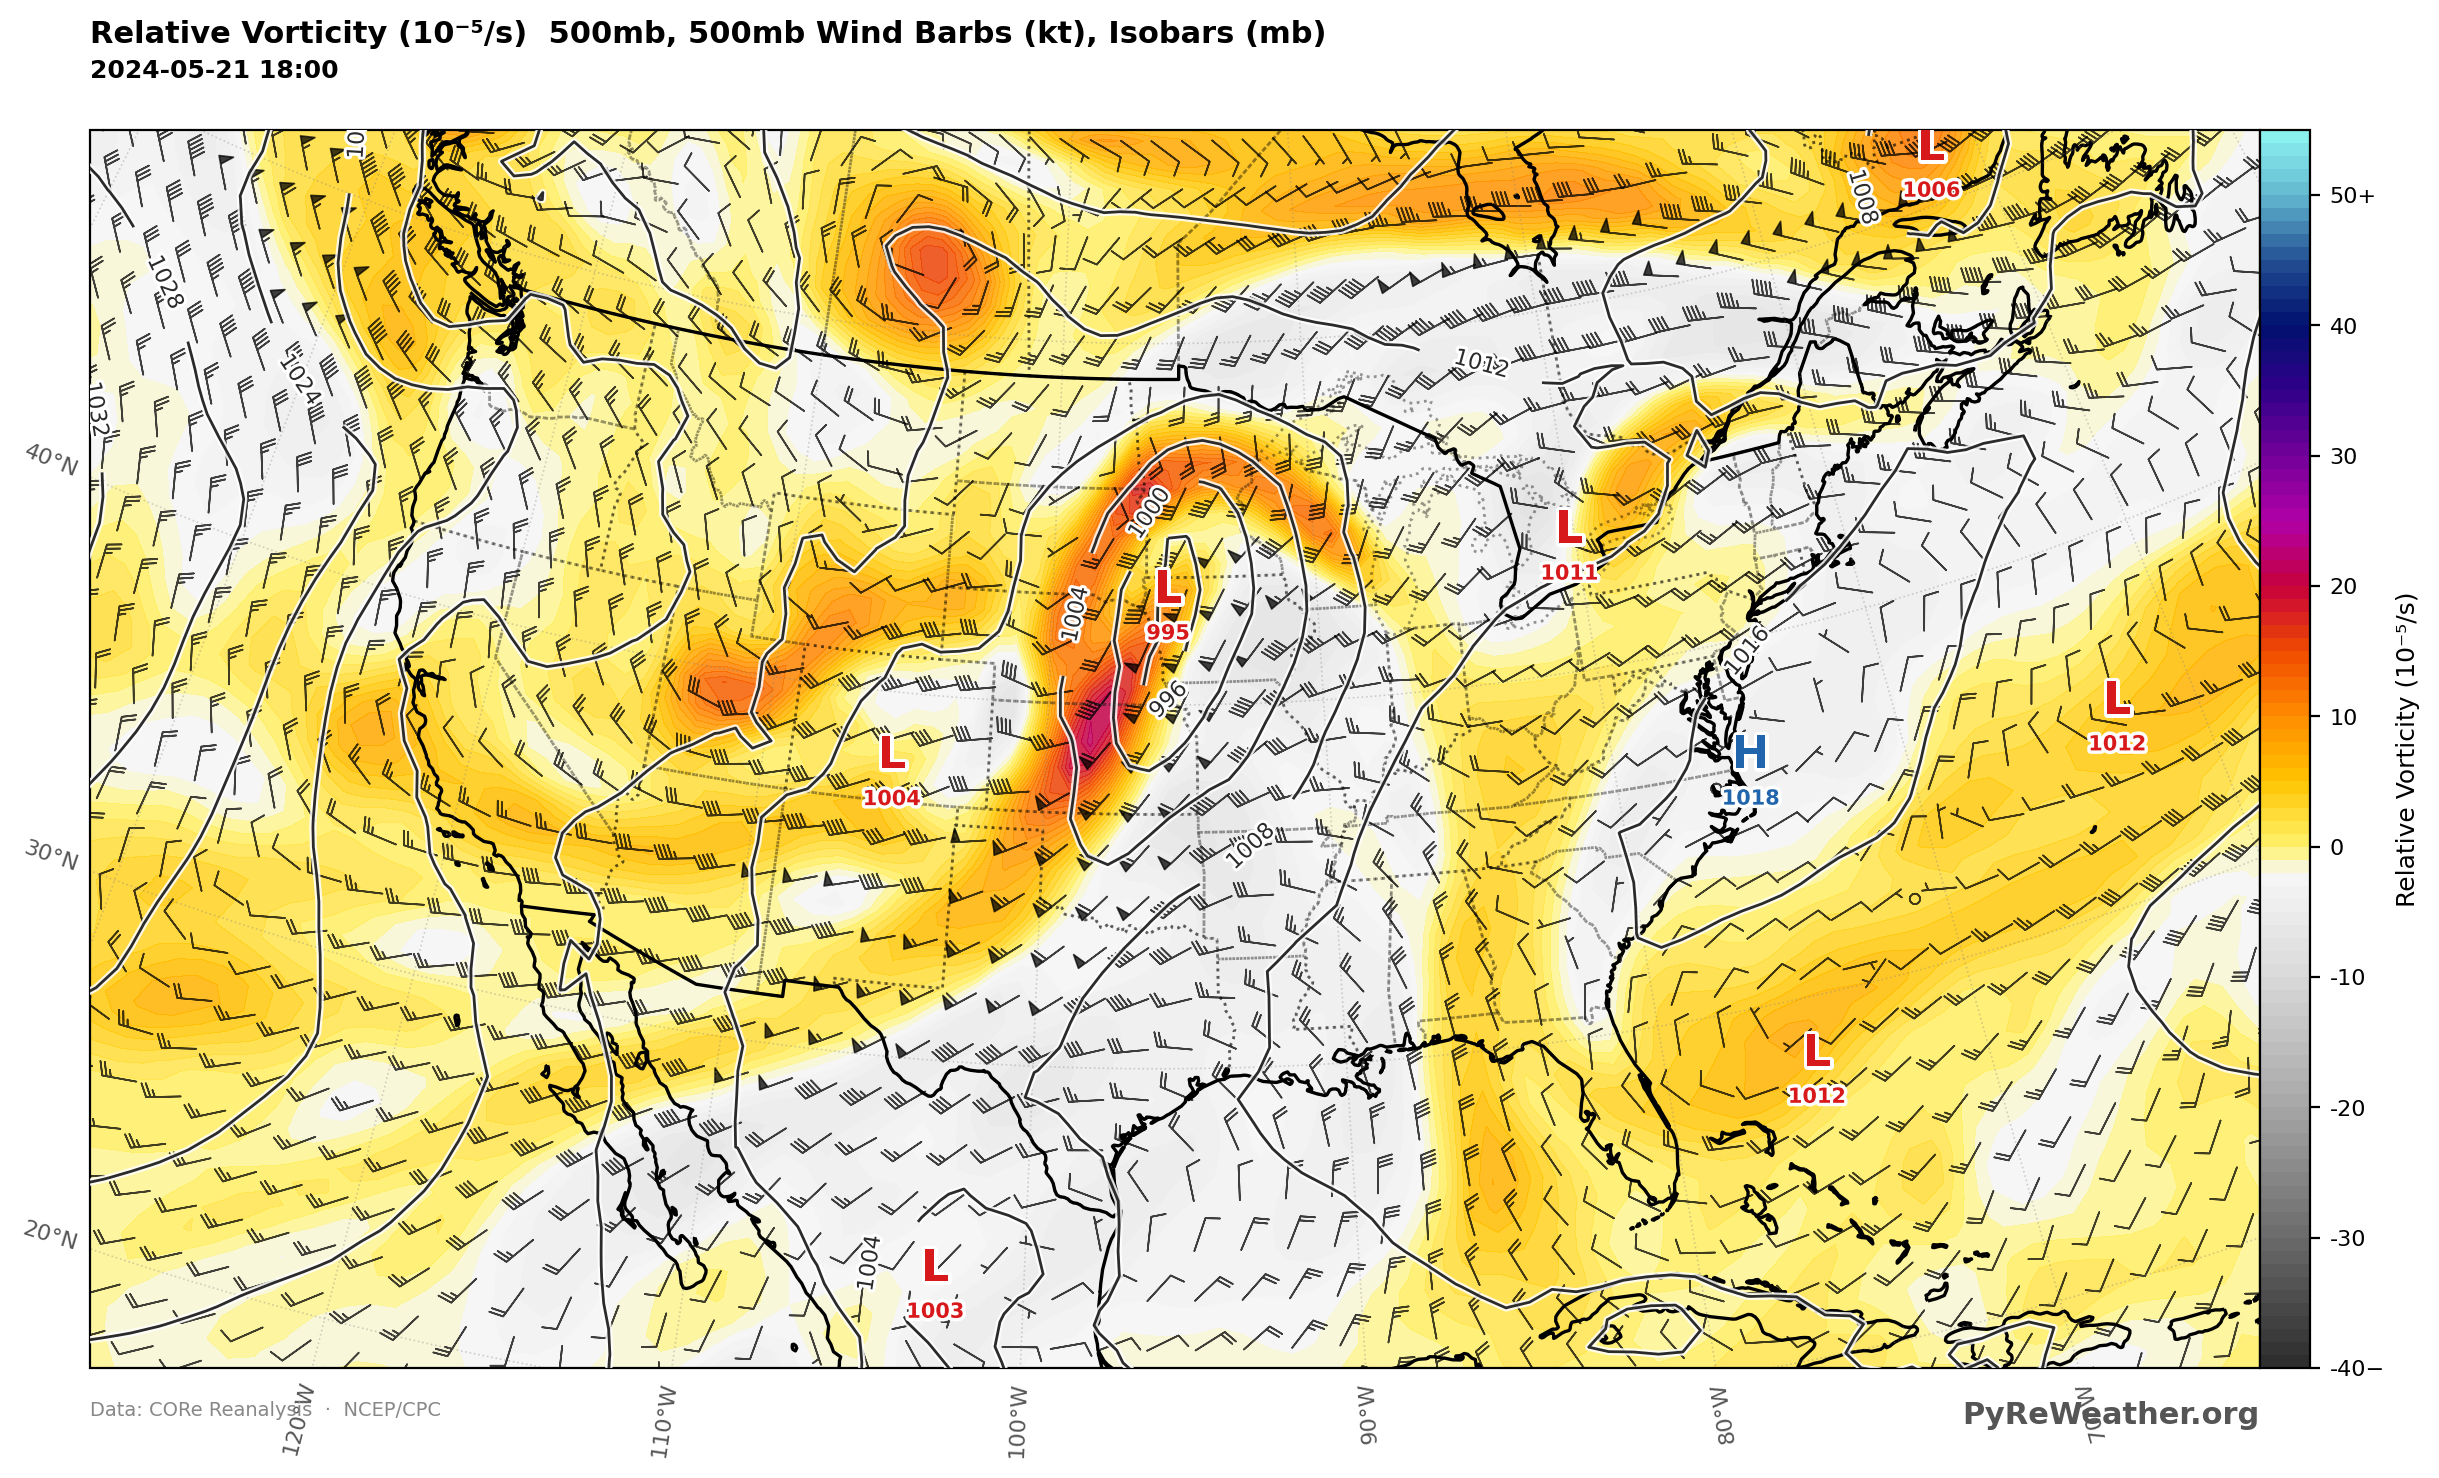
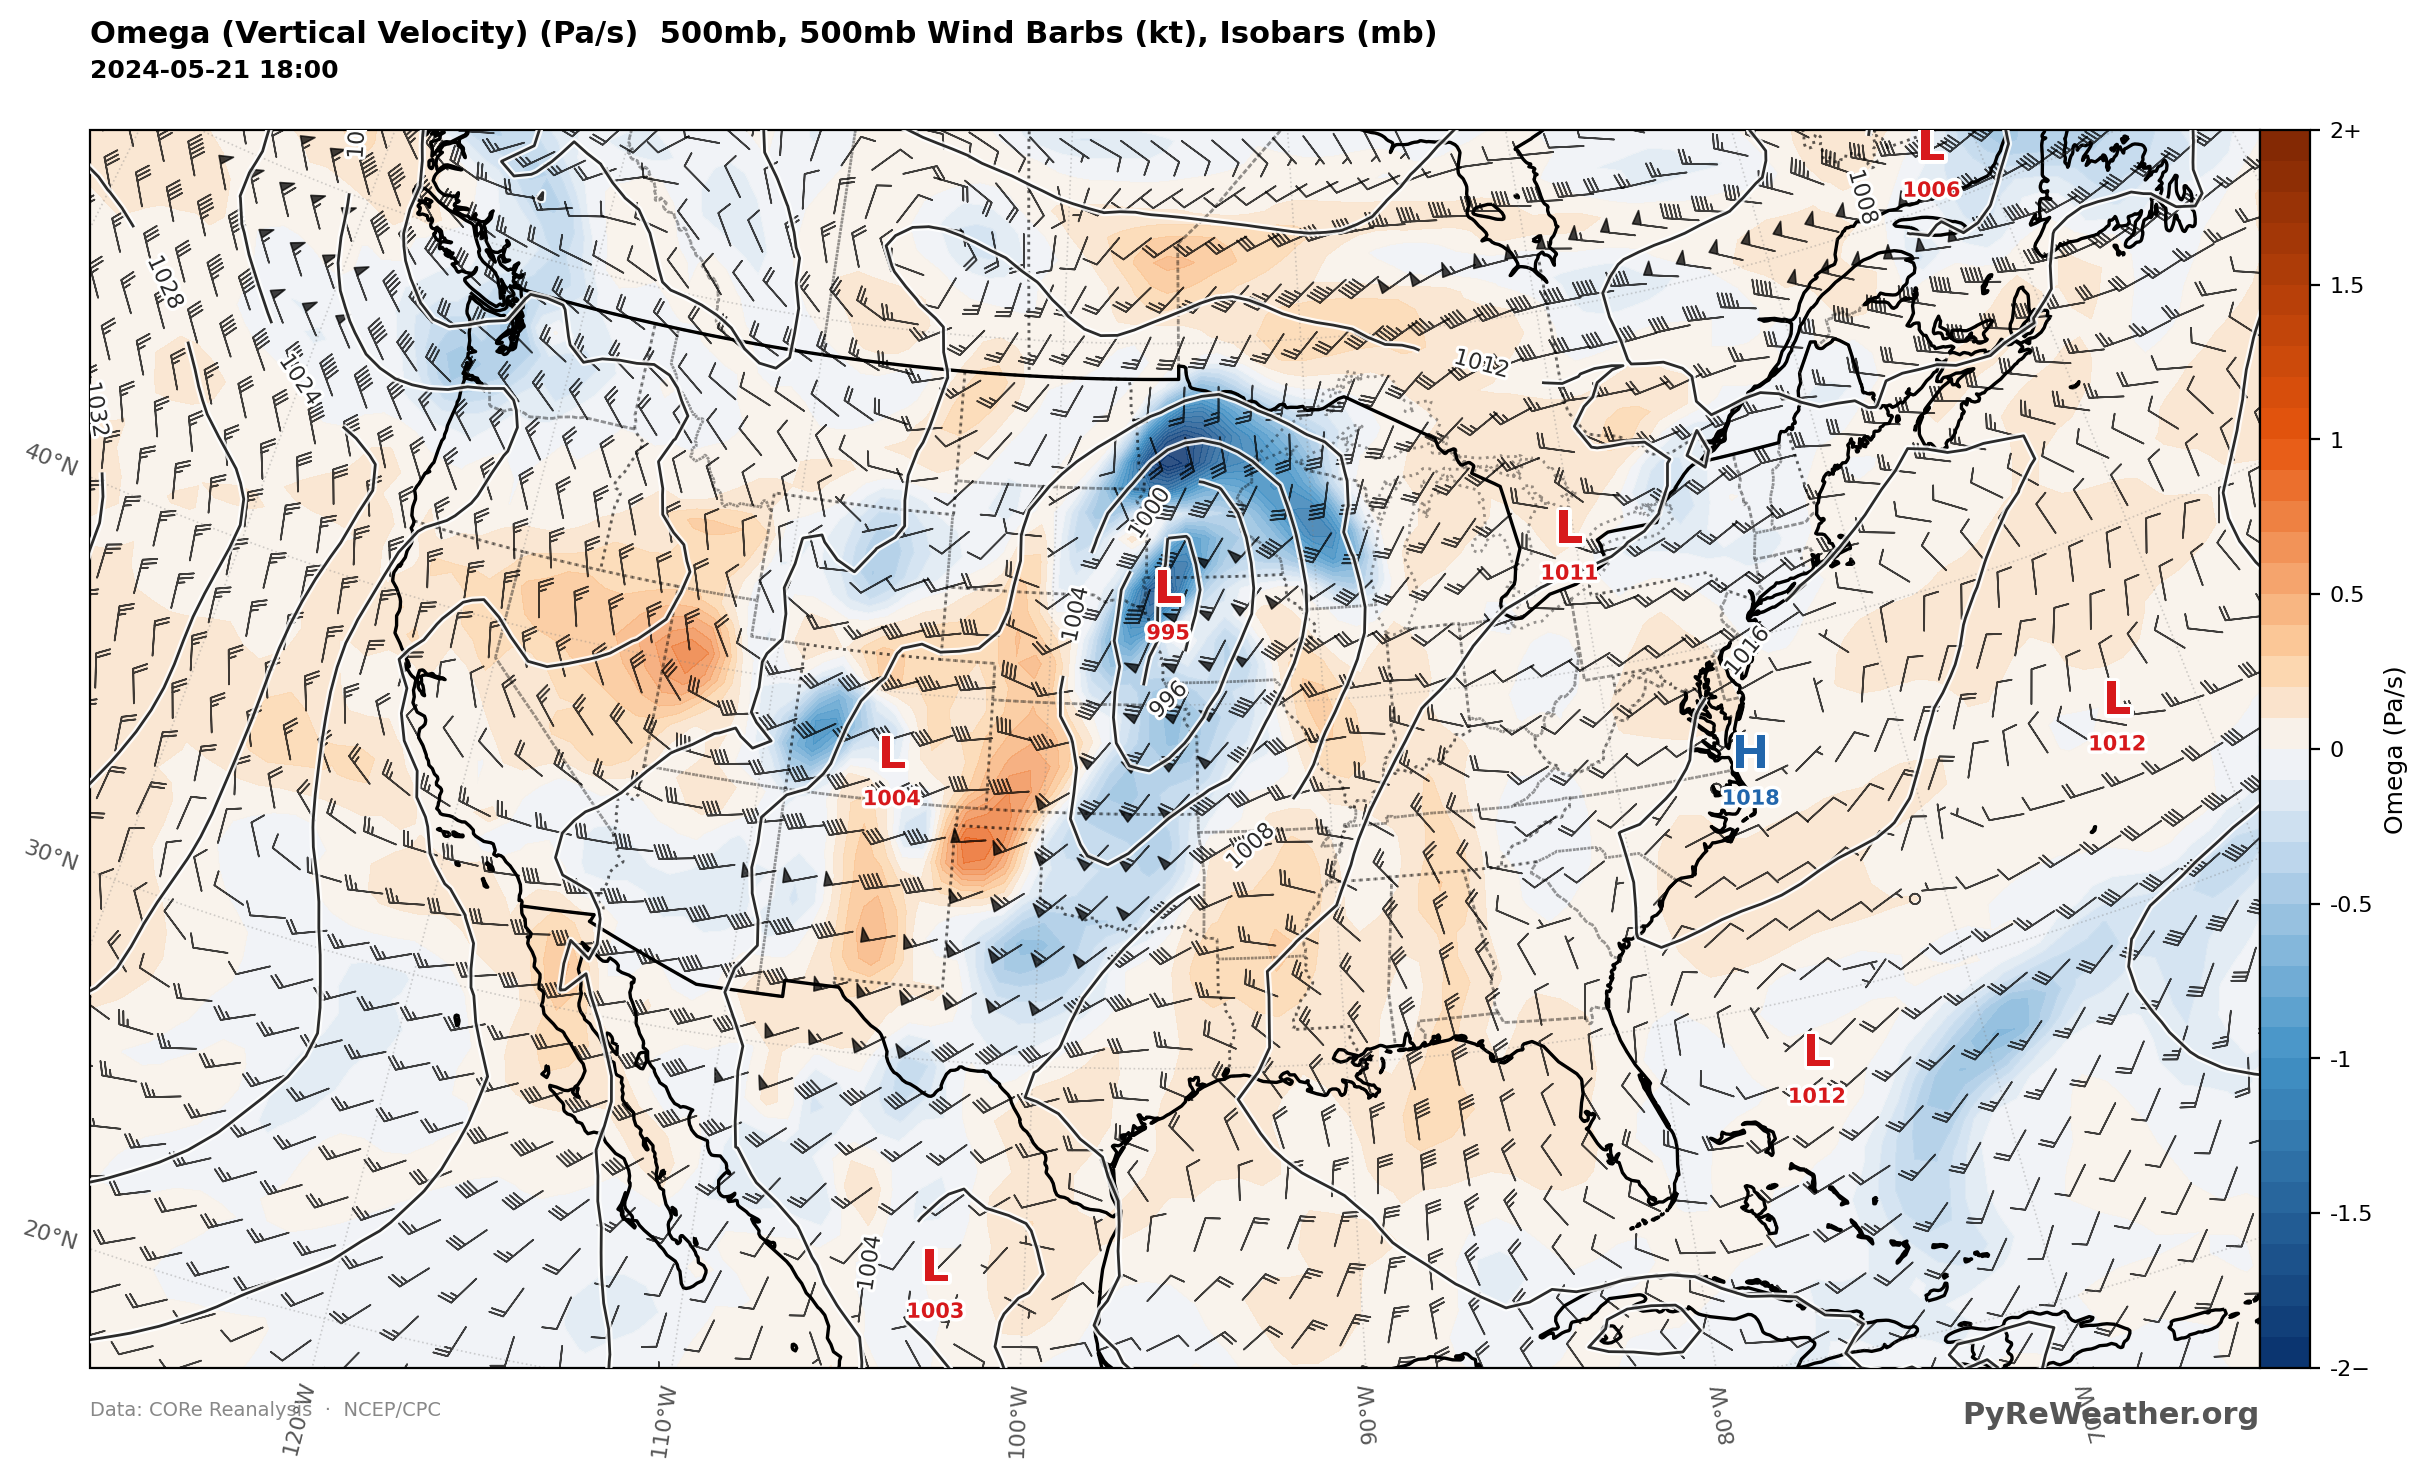
Let's take a look at two other variables that help identify lift in the atmosphere. Vorticity and Vertical Speed.
Just select Vorticity from the Variable option. The Level will stay at 500, but you can also change it to look at other levels. 500mb is the best level for vorticity in most cases.
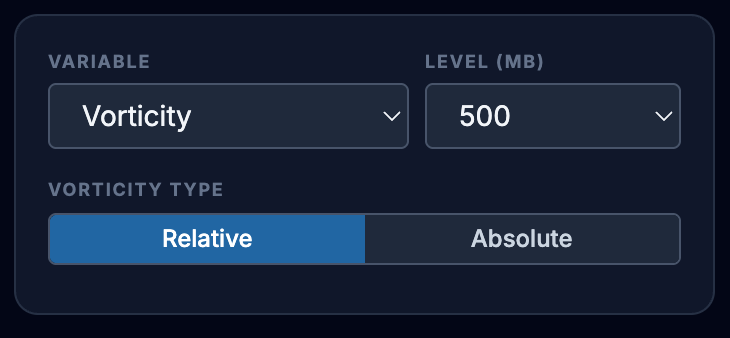
Relative Vorticity, 500mb with MSLP and H/L Centers May 21, 2024, 18Z
Finally lets take a look at Omega, or Vertical Velocity. You can also check this at multiple levels to see how deep or high the vertical motion extends.
Just select Omega from the Variable list and click Generate. You can leave the level at 500mb for the next map, but you can also check other levels if you like. What level has the strongest vertical velocity? (Keep in mind that a negative value is upward movement)

Vertical Velocity 500mb with MSLP and H/L Centers May 21, 2024, 18Z
What else would you want to know about either the setup or the progression of this severe weather day? The supercells developed over several hours during the day, what was the tipping point of tornado formation? How long did these storms last and where else did tornados touch down? What about rain or hail? Would you want to cross reference with satellite or radar imagery?
There are plenty of other things we could explore in this setup: advancing to the next three-hour interval, precipitation rates and totals, storm-relative helicity, cloud cover, and more. But I'll leave some of that for you to explore on your own.
You can also try the same exercise with other major tornadoes and outbreaks. Multi-day outbreaks are especially interesting because you can watch the environment change over time, including the daily heating and cooling cycle and the repeated movement of moisture, fronts, and disturbances through the region.
A few to try:
April 11–12, 1965 - Palm Sunday Tornado Outbreak April 3–4, 1974 - 1974 Super Outbreak May 31, 1985 - Niles-Wheatfield F5 and surrounding outbreak August 28, 1990 - Plainfield, Illinois F5 tornado May 8, 2003 - Moore, Oklahoma and the May 2003 tornado outbreak June 12, 2018 (Brazil / Argentina) - Use the region selector to choose South America, and remember that things spin the opposite way in the Southern Hemisphere.
Here are links to the Greenfield maps in case you have trouble finding any of the options.
Map Links
- Surface Temperature (2m) and Wind, 5-21-24, 18Z
- Relative Humidity and Wind, Surface (2m), 5-21-24, 18Z
- RH and Wind, 850 mb, 5-21-24, 18Z
- Wind Speed, 500 mb, 5-21-24, 18Z
- Wind Speed, 300 mb, 5-21-24, 18Z
- CAPE, 5-21-24, 18Z
- 500 mb Heights with Surface Pressure, 5-21-24, 18Z
Hopefully this gave you a feel for some of the fundamental tools in PyRe Weather and how you can combine different maps to explore the setup behind a historical severe weather event.
How did it go? Let me know. I'm always interested to hear what other people find fascinating and what questions you want to investigate next.
Happy Mapping!