Mapping El Niño / La Niña with Sea Surface Temperatures and new Tropical Pacific Views
What's a climate reanalysis mapping site without the ability to Visualize El Niño and La Niña events? While there are dedicated sea surface temperature analysis systems that assimilate data from satellite, buoy, ship, and sea-ice information, the CORe reanalysis dataset also contains a sea surface temperature variable that tracks closely and is suitable for visualizing changes, patterns and magnitude of sea surface temperature variations over time. Here's how to find it on PyRe Weather.
What's a climate reanalysis mapping site without the ability to Visualize El Niño and La Niña events? While there are dedicated sea surface temperature analysis systems that assimilate data from satellite, buoy, ship, and sea-ice information, the CORe reanalysis dataset also contains a sea surface temperature variable that tracks closely and is suitable for visualizing changes, patterns and magnitude of sea surface temperature variations over time. Here's how to find it on PyRe Weather. If you're on a laptop you'll appreciate our new layout which is much easier to manage allowing variable selection independent of the screen area where the maps are displayed. I think it's much more intuitive!
Create your Map Recipe with the new Sidebar Control Area
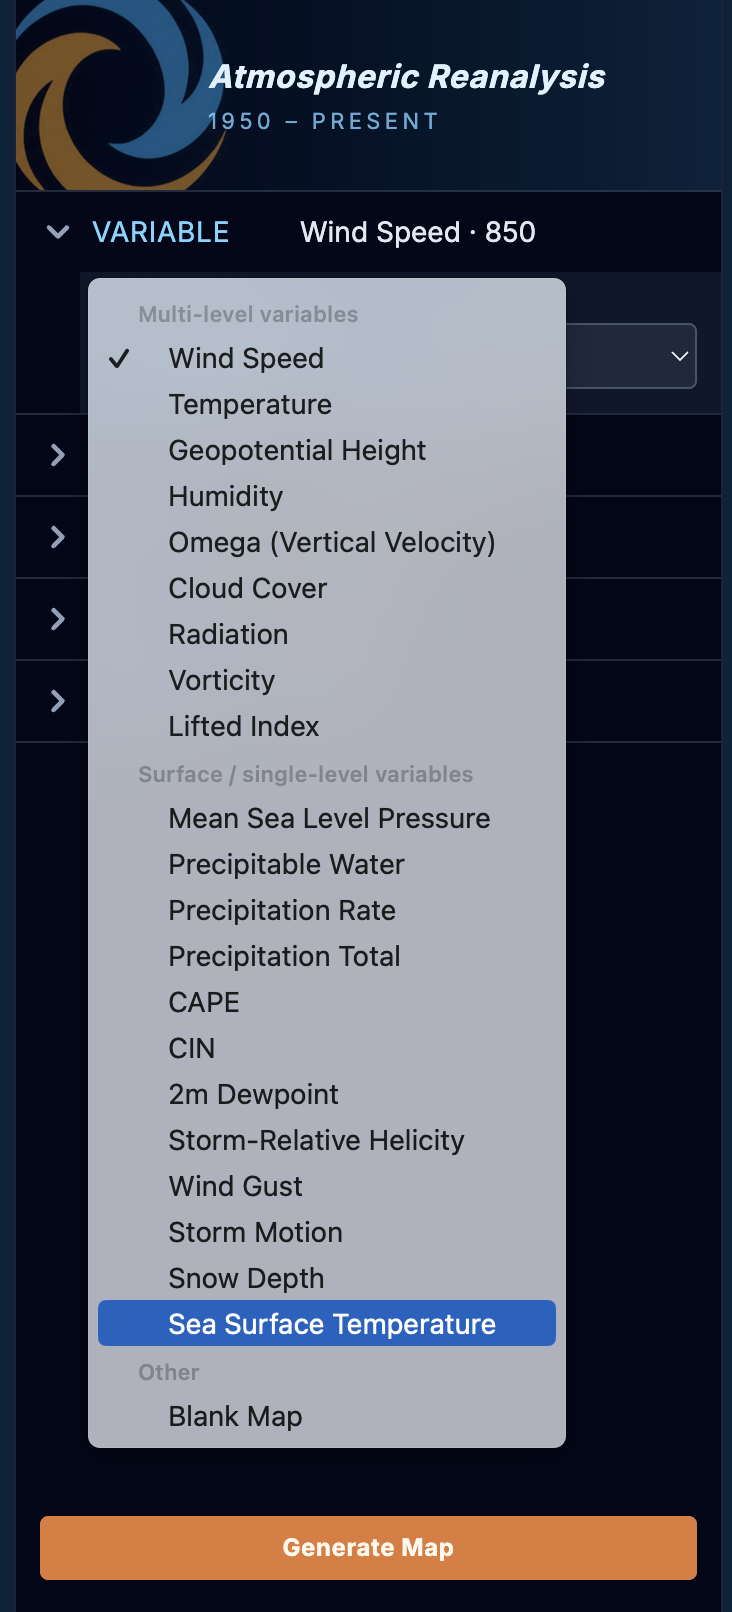
1. Choose your variable
First check the listing of variables and scroll down to the surface options and select Sea Surface Temperature.
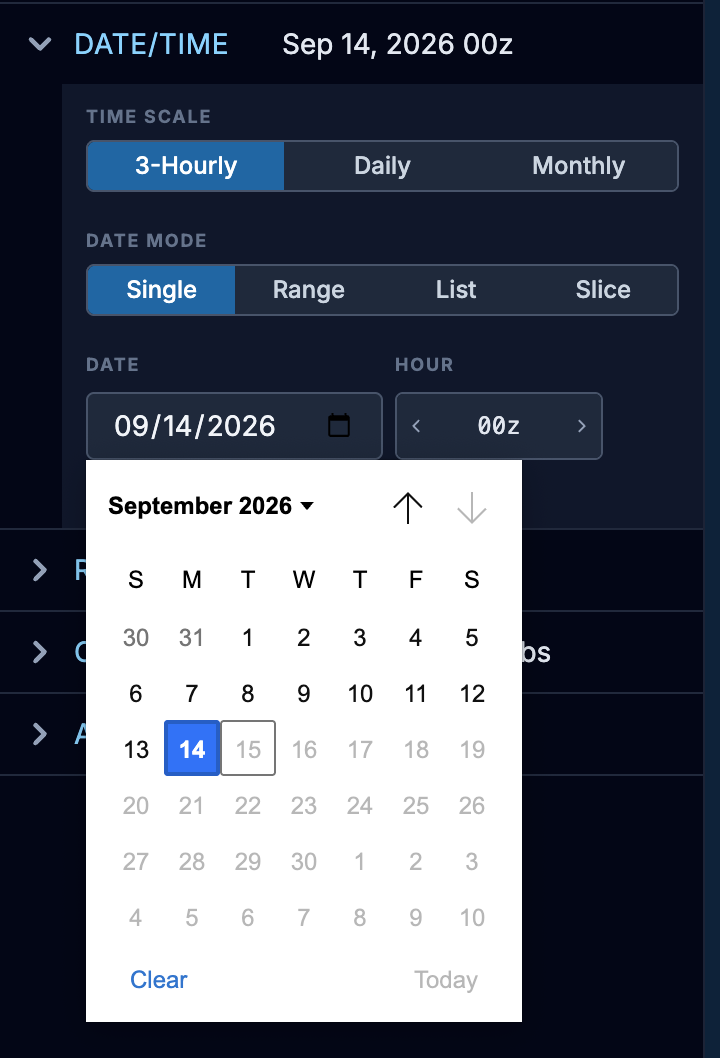
2. Select your Date(s)
Then just continue down the menu of options to select your date(s), regions, any overlays and type of analysis (raw, anomaly or normalized anomaly). For dates, try selecting the current date (it's Sept 15, 2026 as of this writing) for an El Niño view - August 2026 is the most recent complete month as of this writing. Or you can select September 14th (full day or a specific hour are about the same thing as sea temps don't change with time of day as readily as land temperatures do). If you want to view a La Niña event, Dec 25th, 2010 is a great option to compare to.
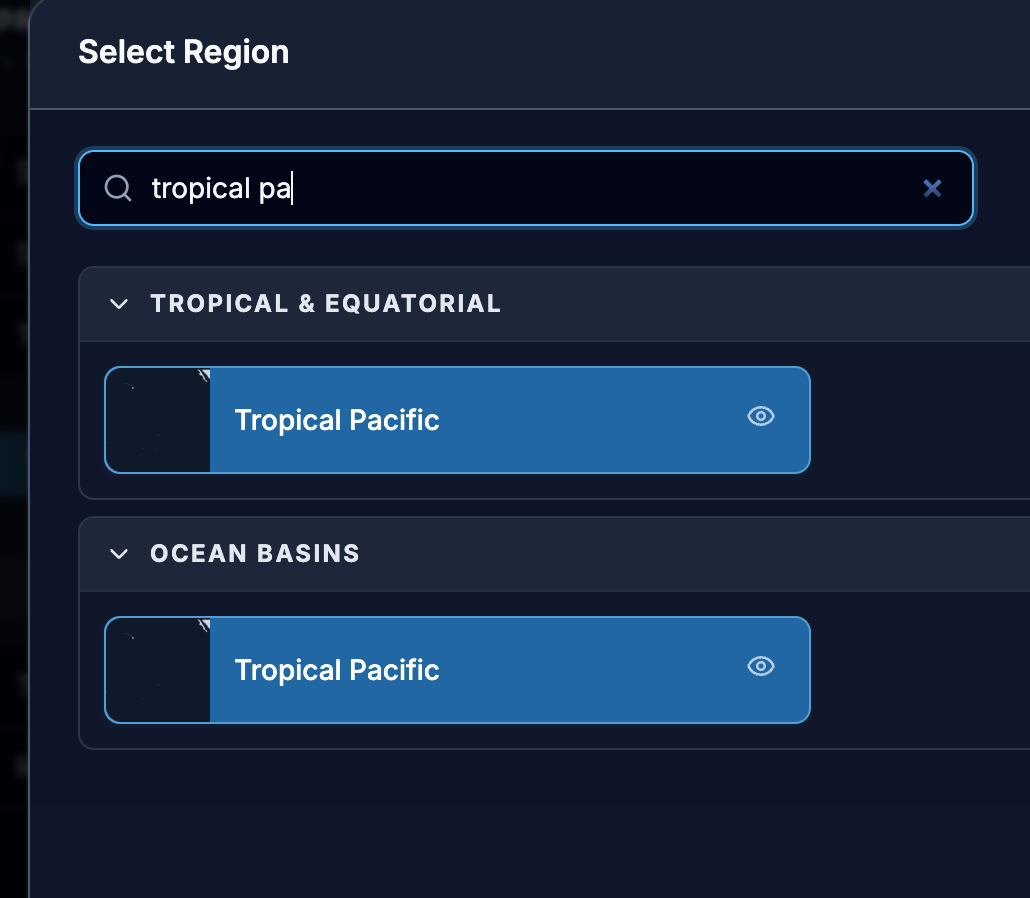
3. Choose the Region you want to map
For Region, Try any of the new regions added, Tropical Pacific, Pacific Basin or Pacific Global. World works well too, it all depends on how big of a window you want to see.
4. Modify any Overlays (Number Grid, Color Scale, Wind Barbs)
For Overlays, the next option down, we have a new Settings icon (the gear) next to Temperature. Click that and you'll see two options there. The top option is Numeric Grid. Turn this on to see the actual temperature label in a grid over the map itself. This makes it easy to quickly see the temp without having to refer back to the color scale and estimate where it falls on the number range.
The second option is to choose a color scale. Right now the options the show allow us to get some feedback about what looks good and conveys scientific accuracy. So let us know using the feedback form what you think about the scales. PyRe is the default scale but "Tidbitish" may look familiar to you as well. These settings popups for overlays will also allow us to customize more like isopleth colors and withs, custom contour intervals and more.
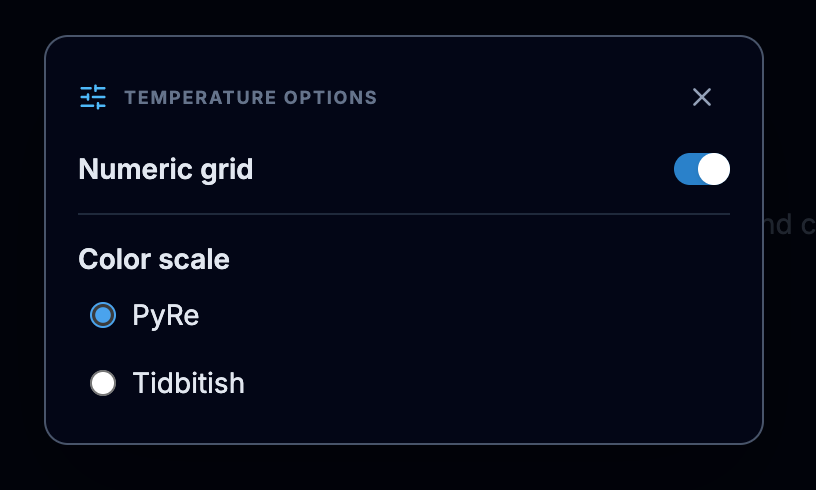
Back in the overlays menu, I'd suggest for now turning off the Wind Barbs for now. They are currently default for most maps because they look cool, but they add some processing time, and for now we just want to focus on the sea surface views.
5. Choose your Analaysis: Raw, Climatology, Anomaly or Normalized
Finally in the Analysis section, I'd suggest first rendering a Raw map. You can save this to your account if you are logged in, so you can go back and review changes without having to re-render the map.
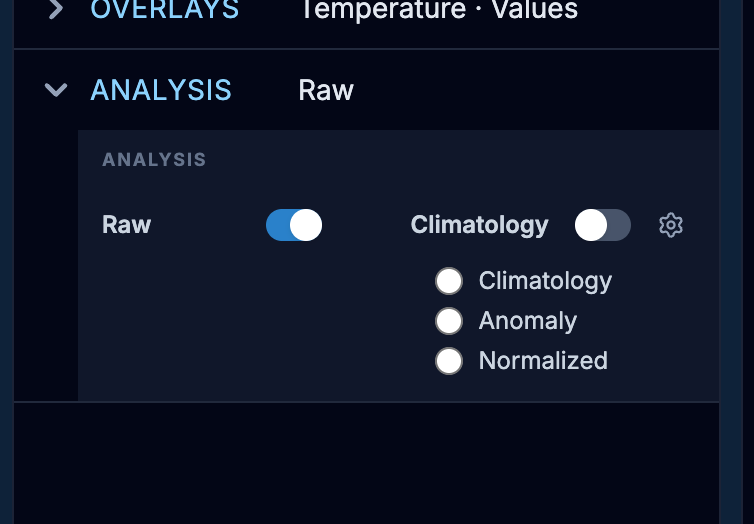
You can check your map recipe when all the menu items are closed by just scanning the labels and make sure it all looks like what you want
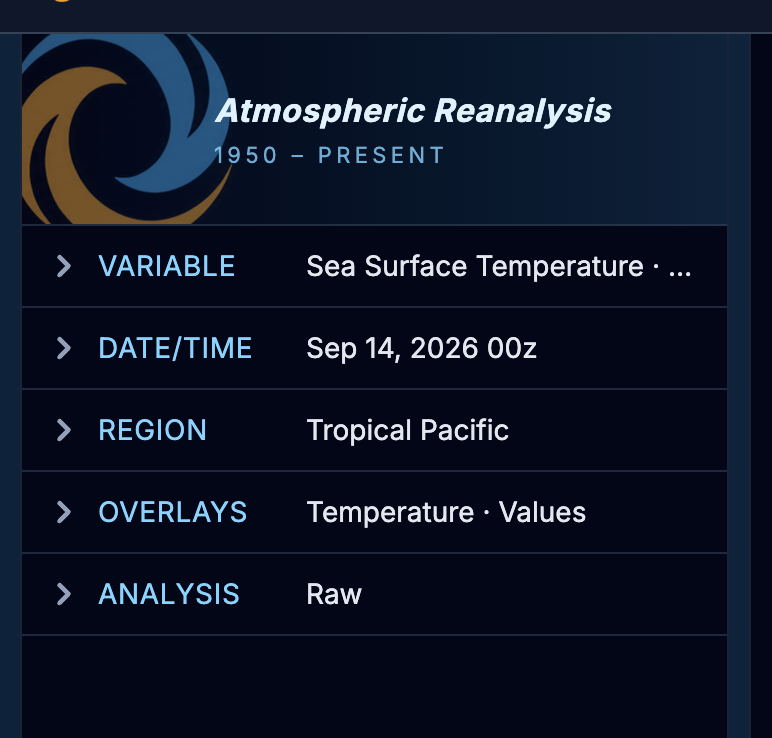
6. Click Generate to see your Creation
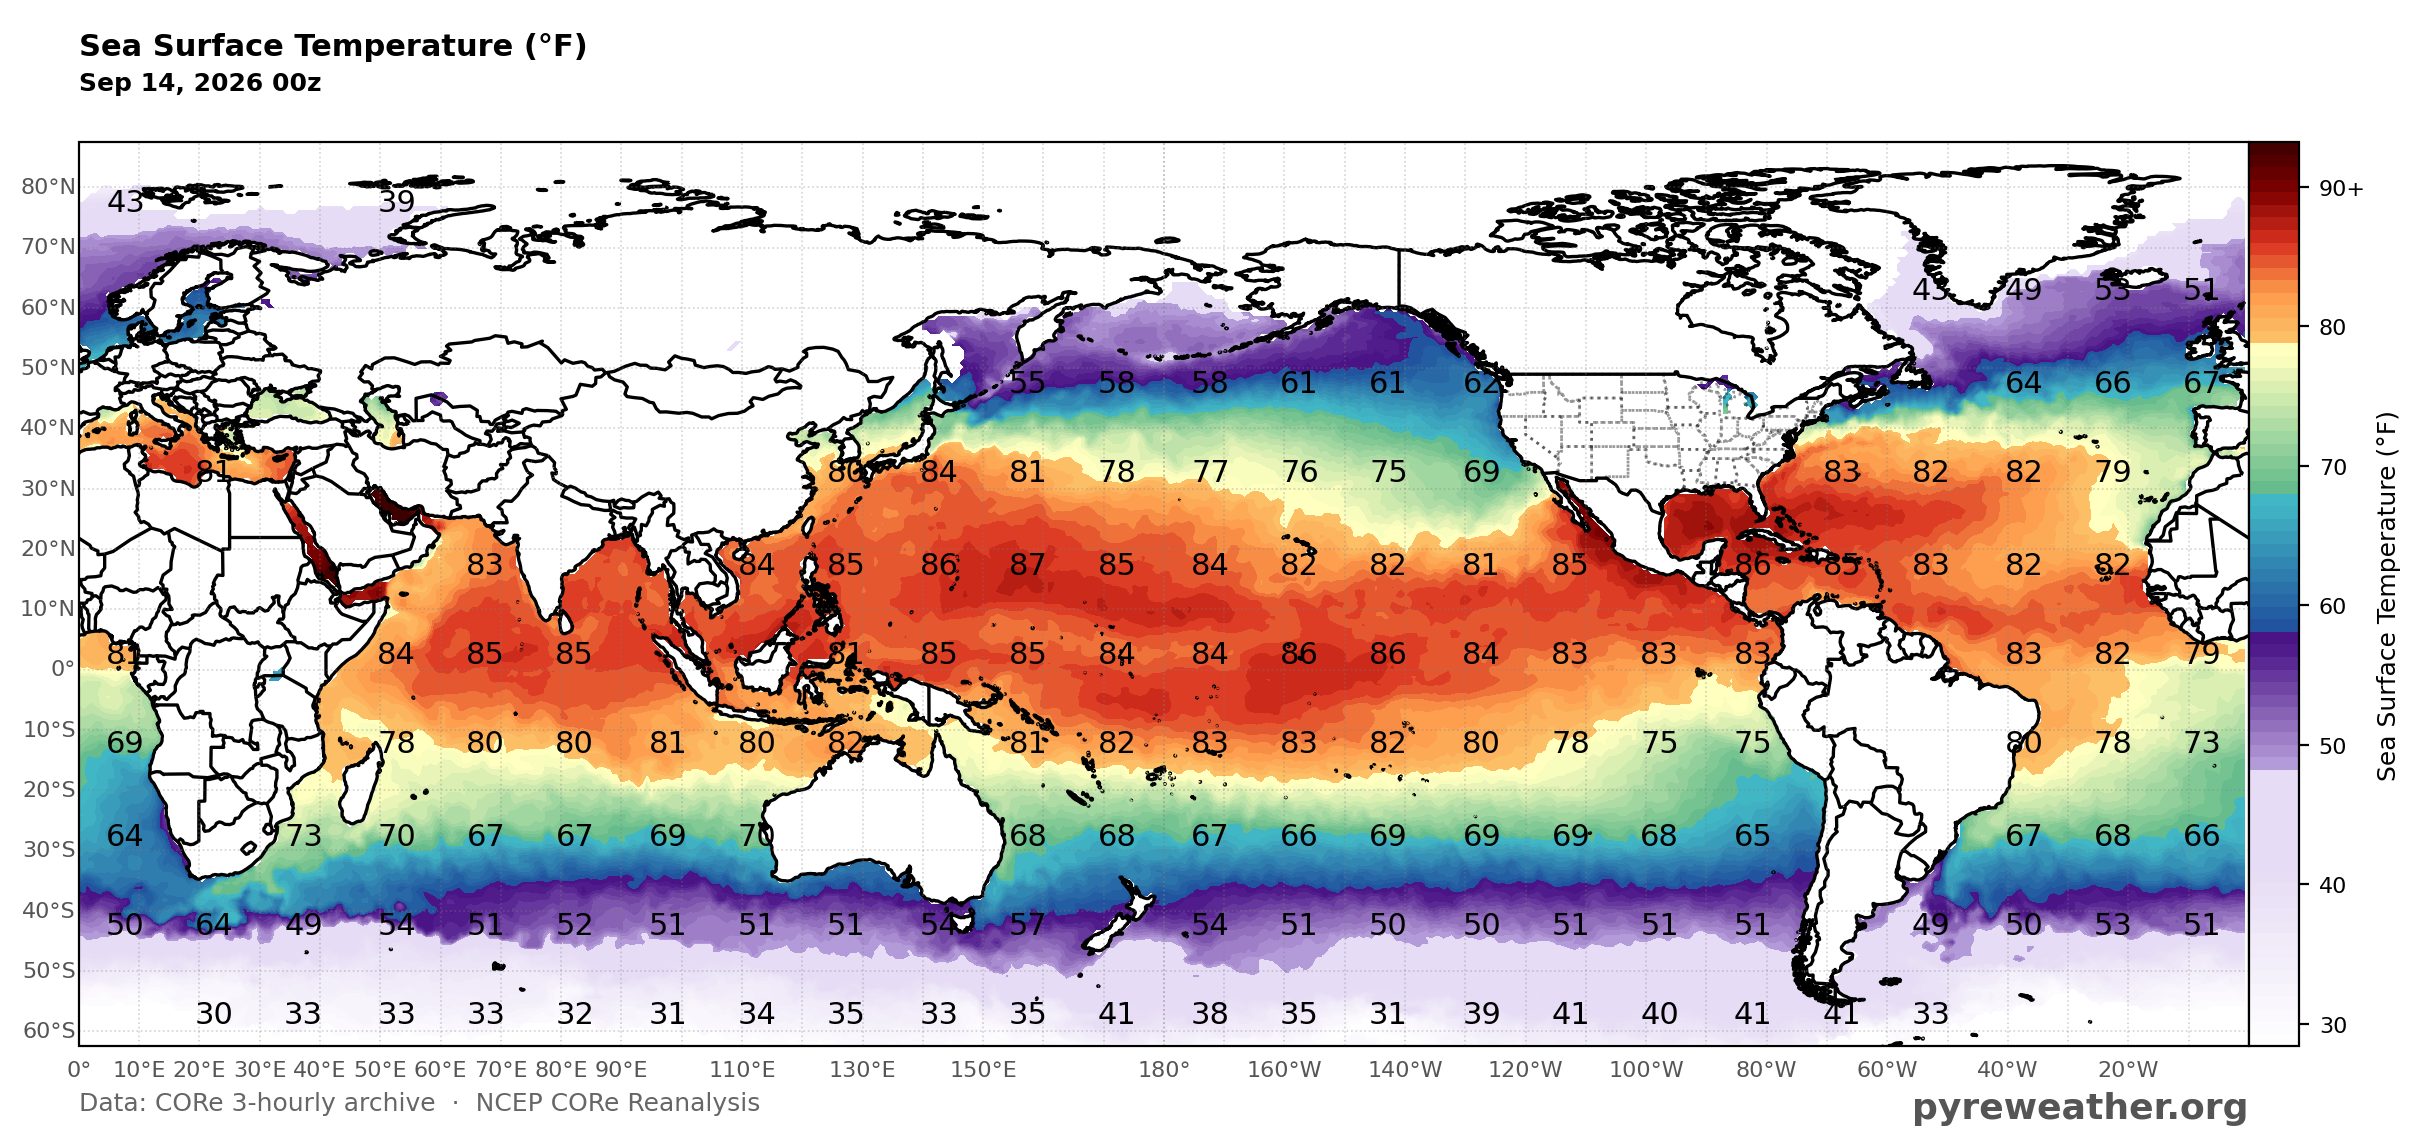
Finally click "Generate" and wait for the magic!

Sea Surface Temperature (F), Sept 14, 2026 00Z
Climatology, Anomaly and Normalized Anomaly Views
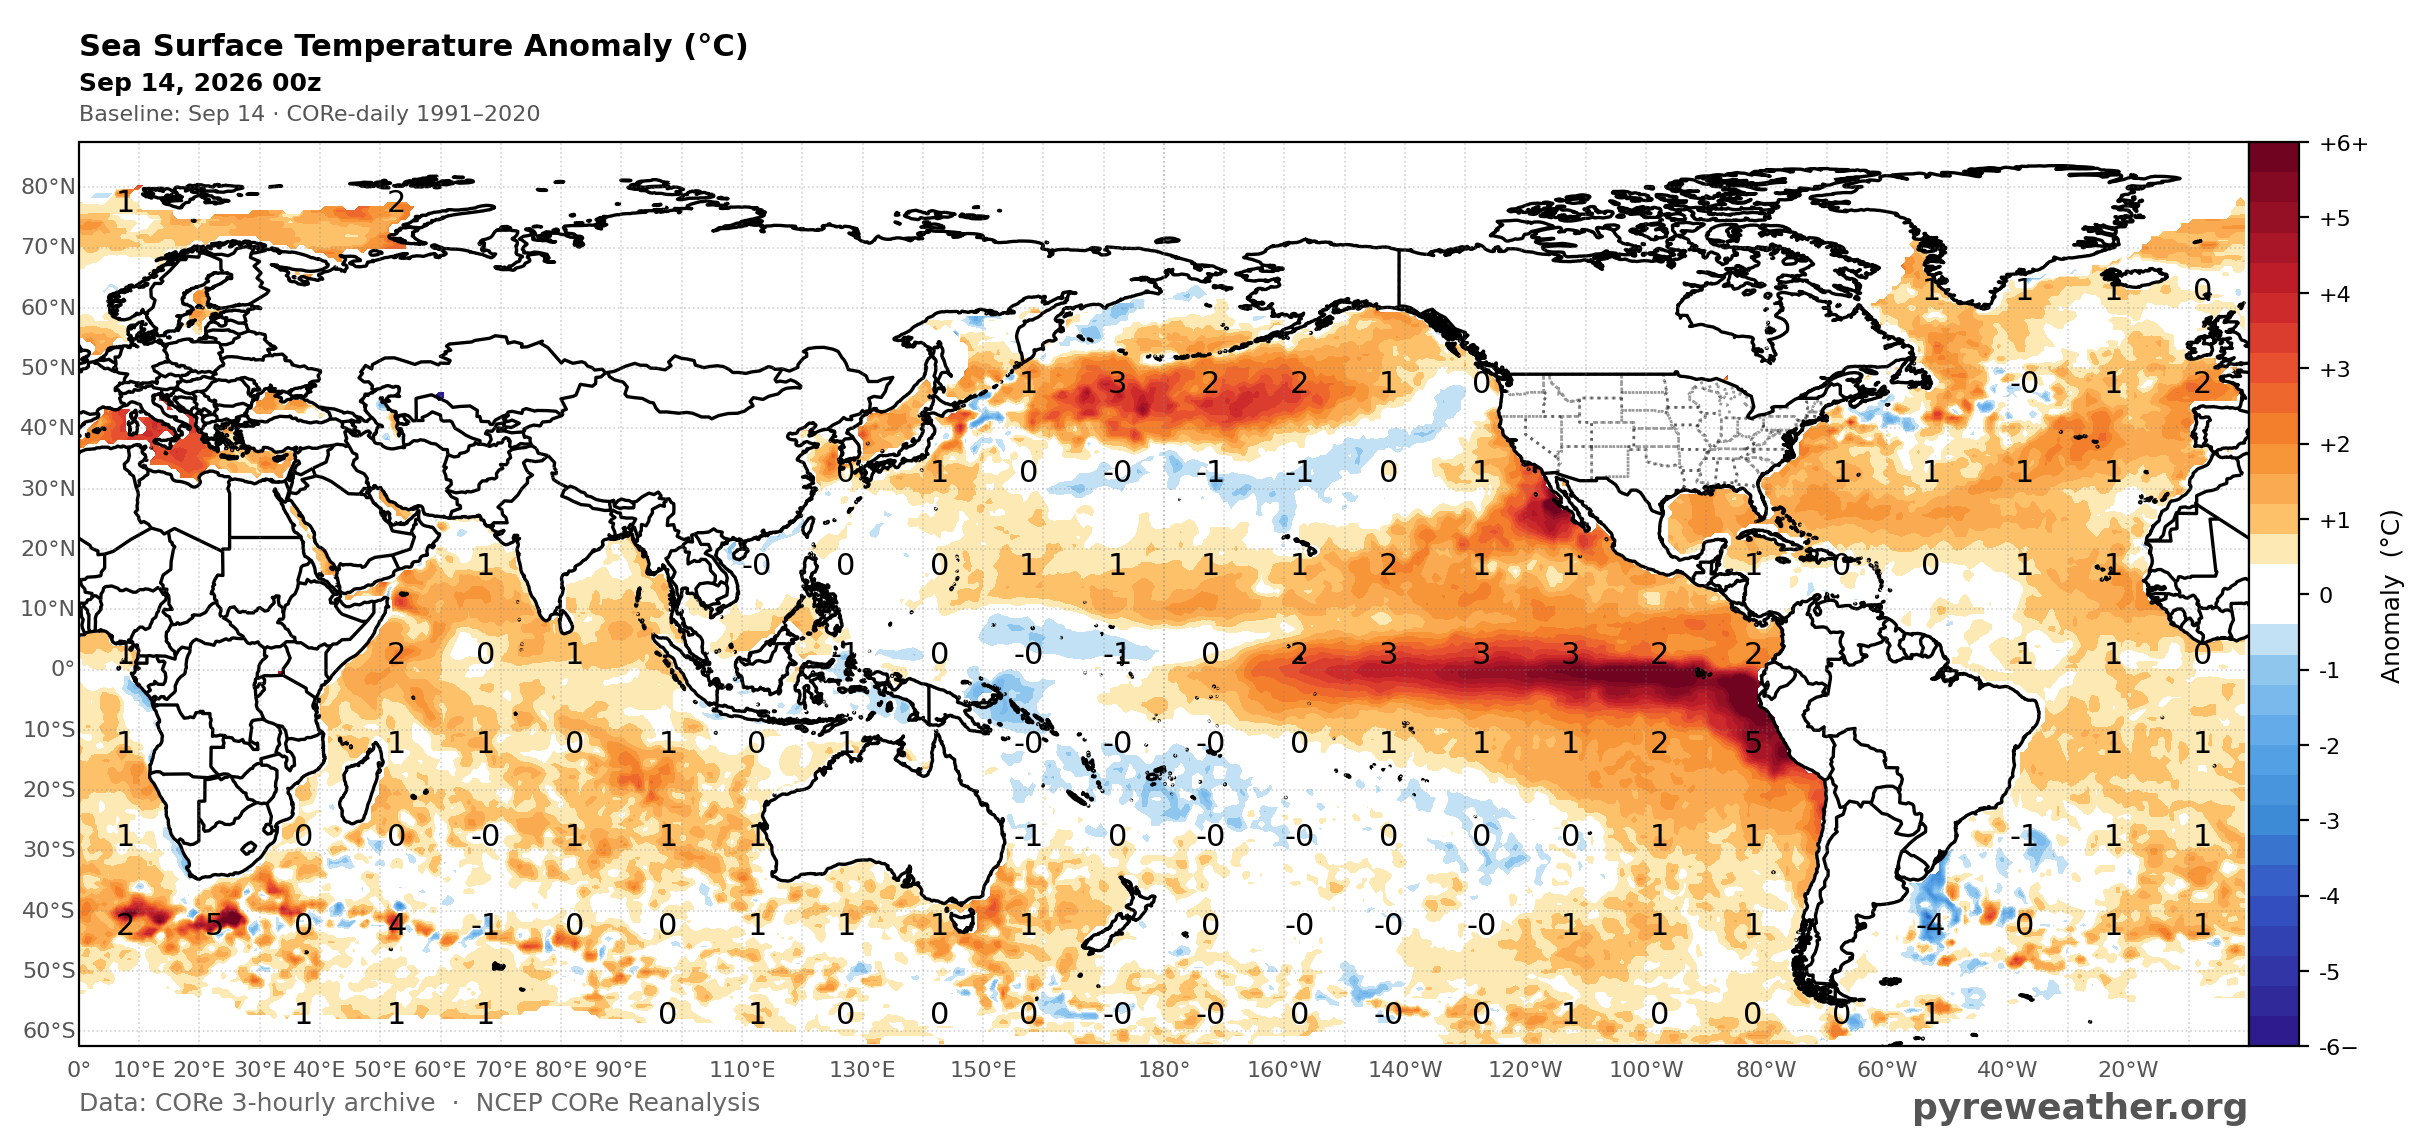
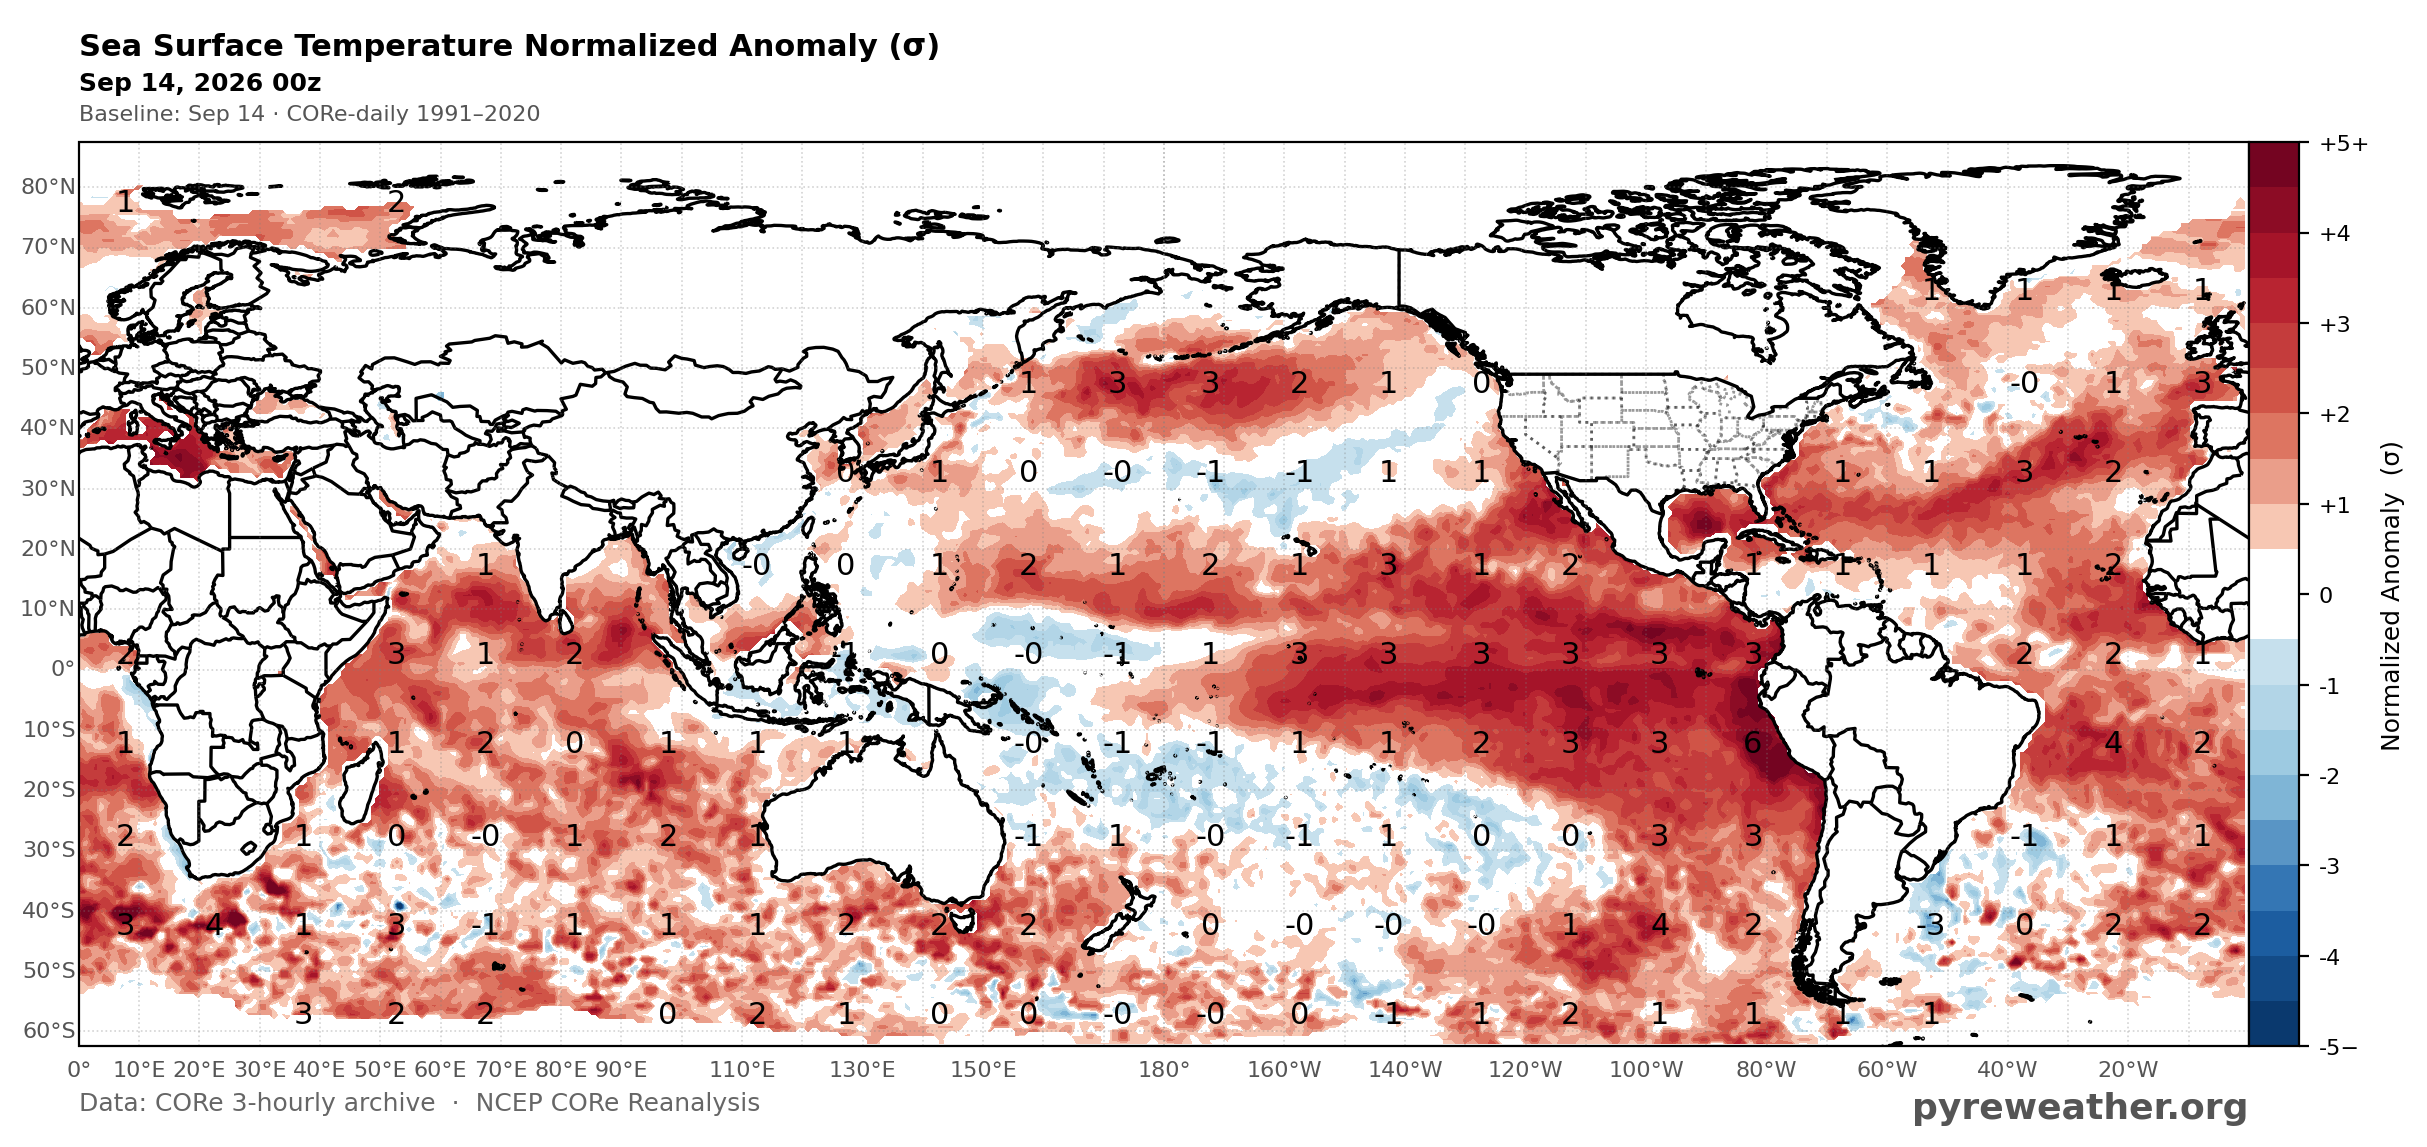
You an also select Climatology (mean SST from 1/1/1991 - 12/31/2020), Anomaly (Difference between your selected time and the climatology mean), or Normalized Anomaly (Standard Deviations from the mean. Anything 5 SD or more is a climatologically extreme event. 3 SD is rare, but they happen just due to the nature of variability from day to day. We minimize this "noise" by using a 15 day windowed mean for any hourly or daily anomaly or normalized maps. Monthly anomalies are already a 30 day window by definition so day to day noise is minimal.
Sea Surface Temperature Anomaly (C), Sept 14, 2026 00Z
Normalized Sea Surface Temperature, Sept 14, 2026 00Z
La Niña Views vs El Niño Views
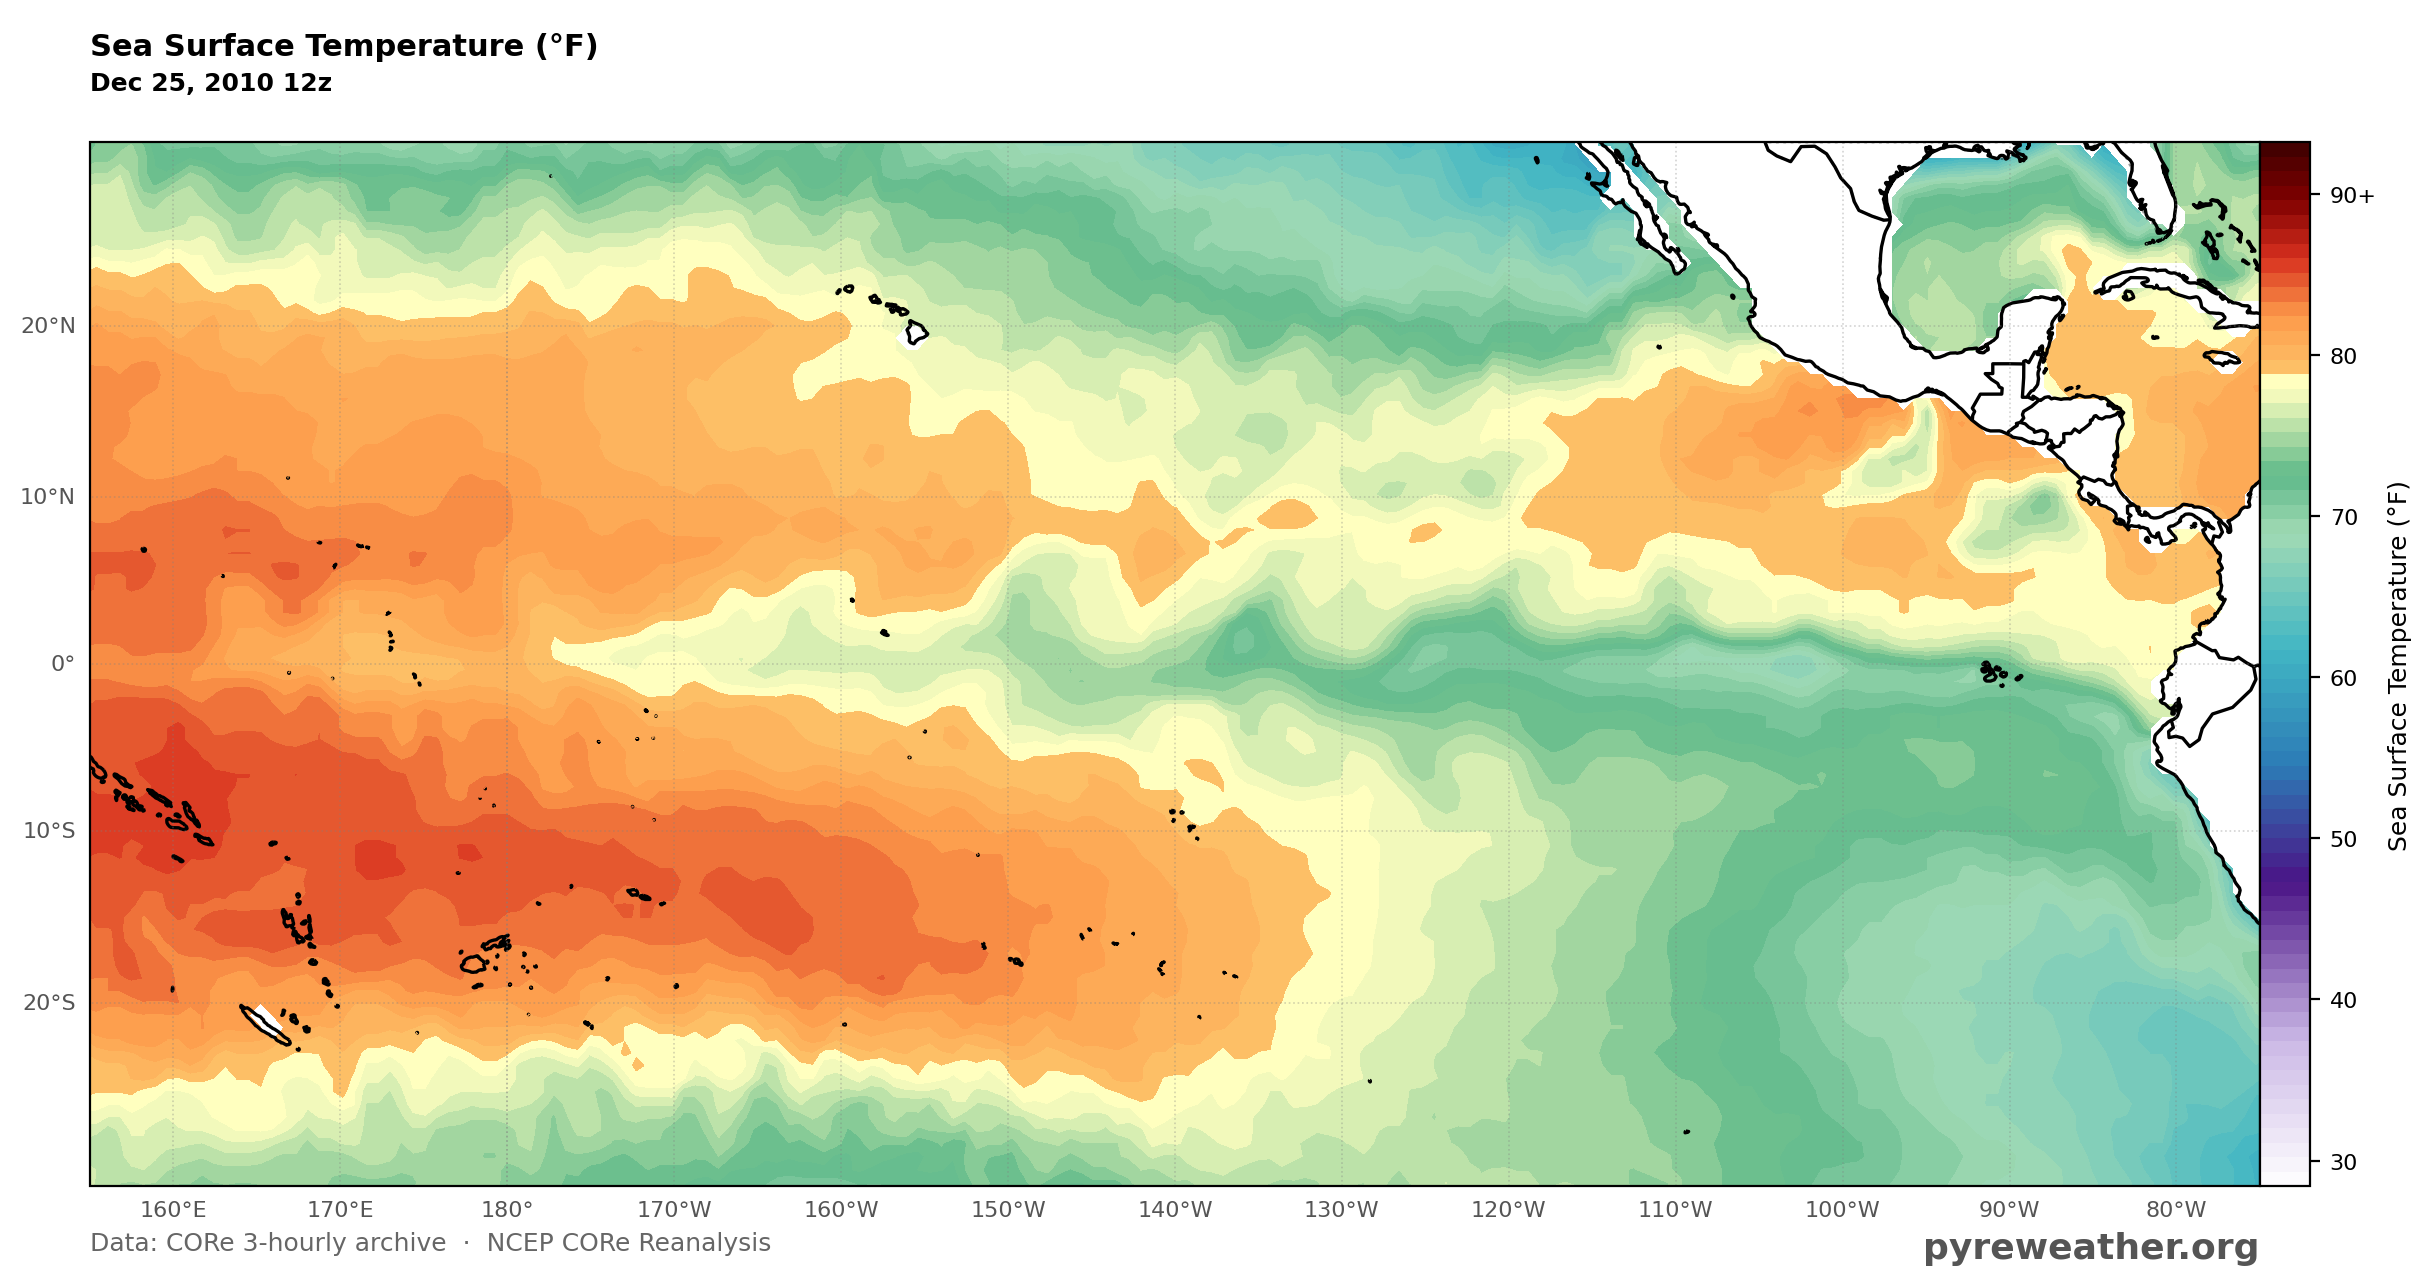
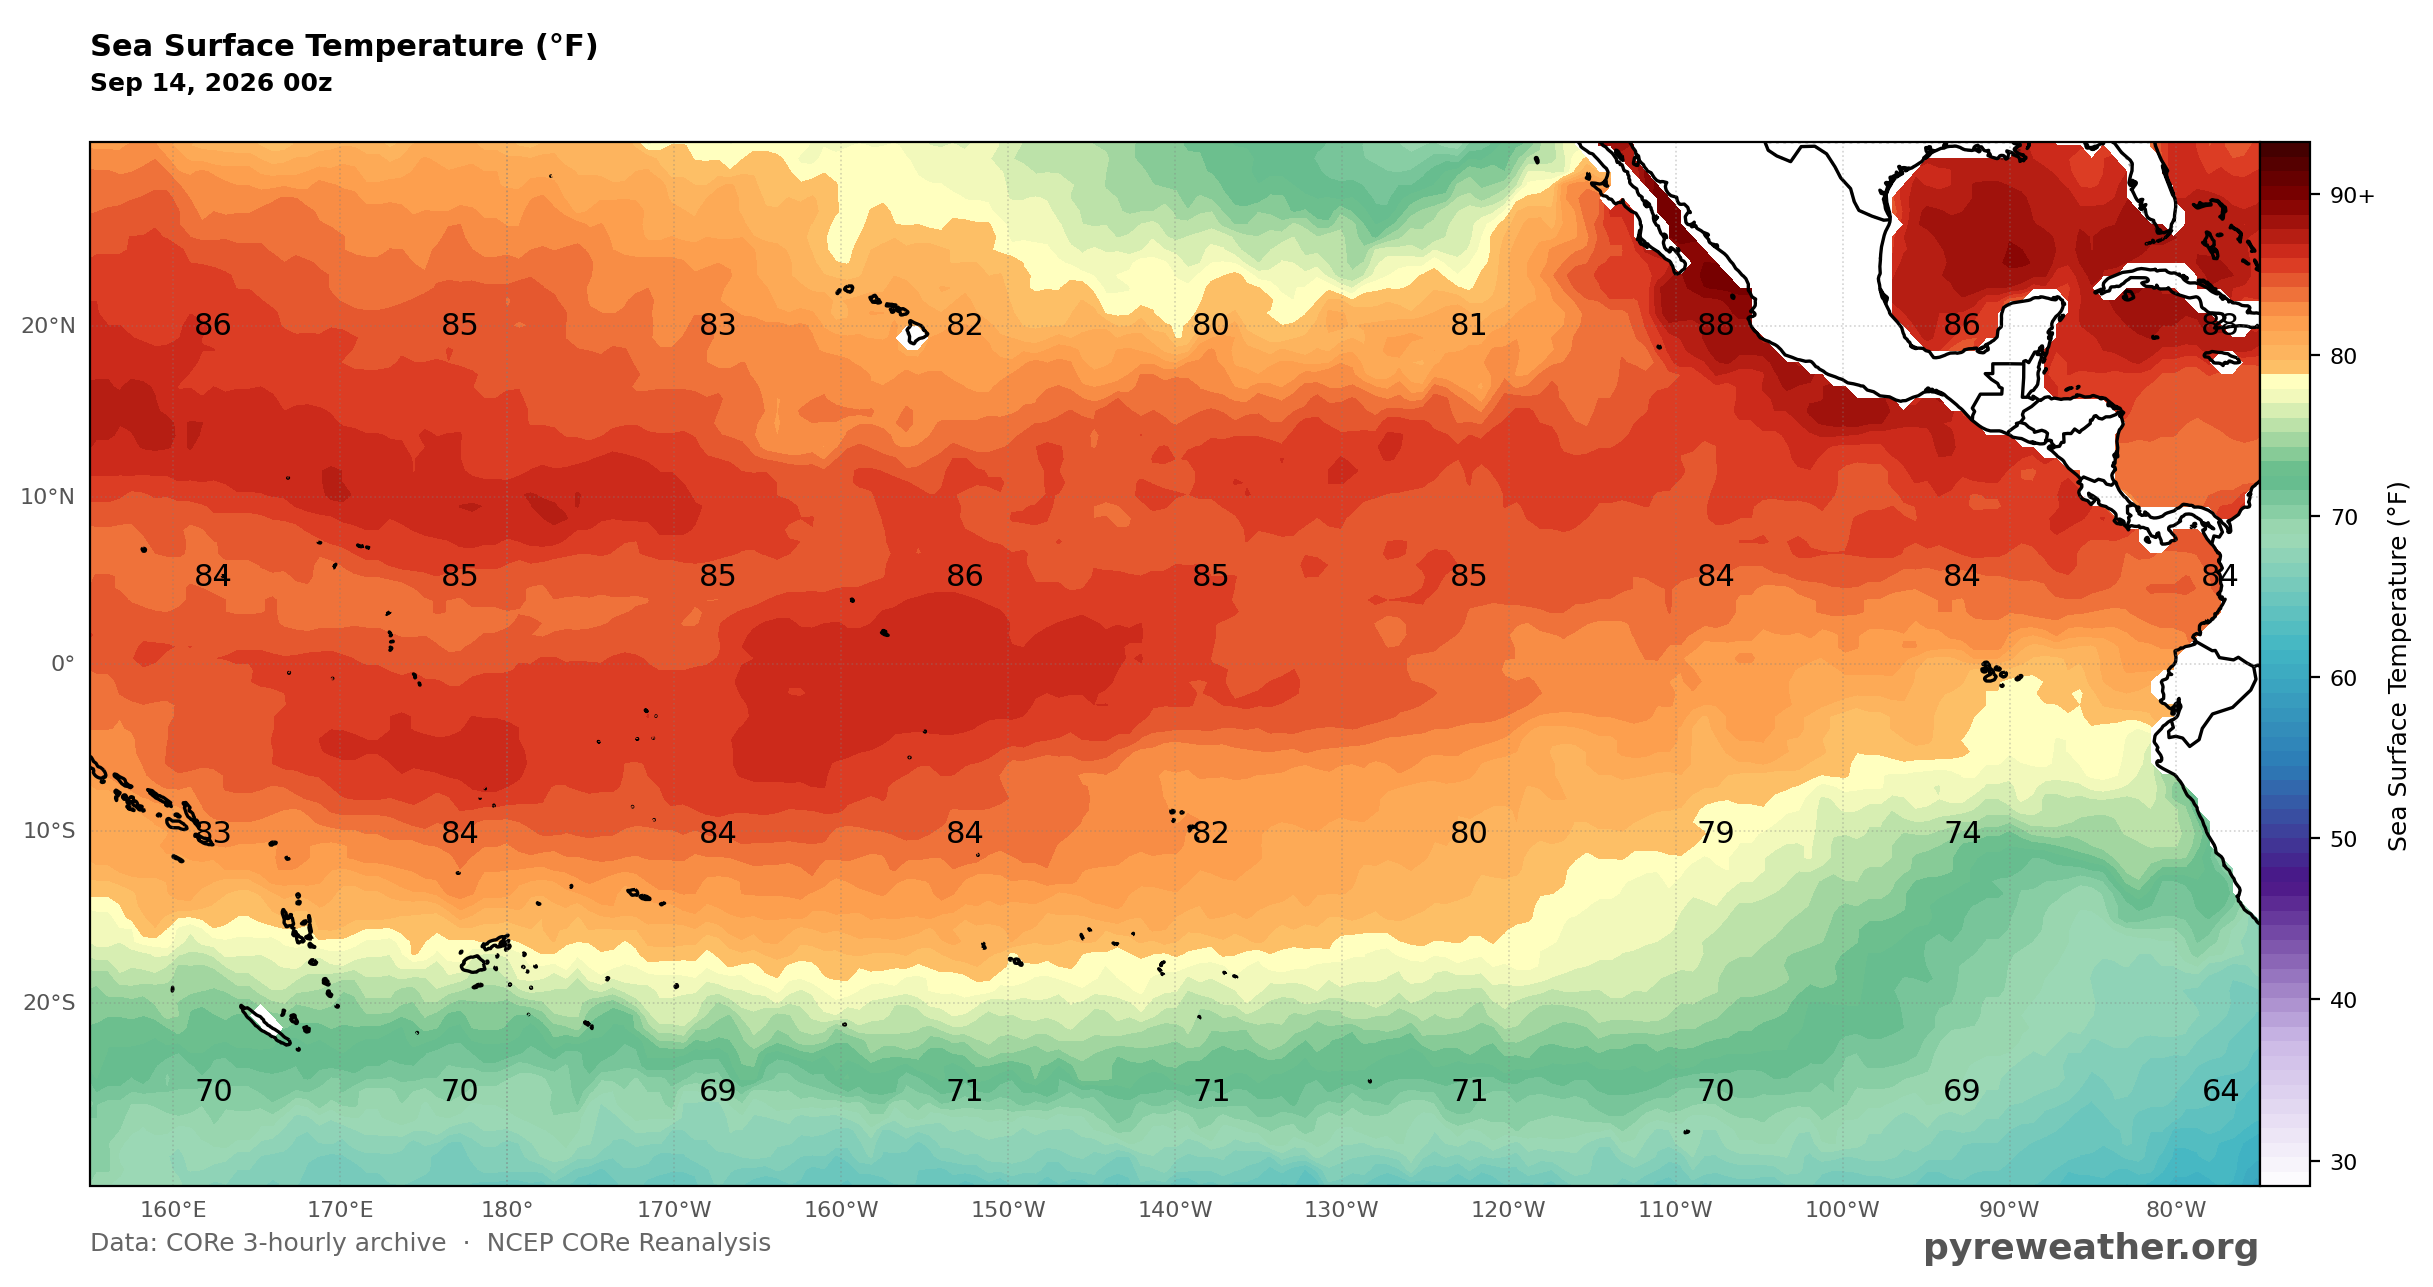
To view a La Niña event, you can consult this RONI Website - Relative Oceanic Niño Index. Here are a few views of the Tropical Pacific Region we just added, the first one is Dec 25th, 2010 a La Niña year, and the second is Sept 14, 2026, an El Niño year.
Sea Surface Temperature (F), Dec 25, 2010 12Z
Tropical Pacific Region
Sea Surface Temperature (F), Sept 14, 2026 00Z
Tropical Pacific Region
Learn more about El Niño from NOAA's Ocean Service Website.
Did you enjoy this mapping tutorial? Let us know using the Feedback form or emailing us directly at support@pyreweather.org.
-SMA